
ListeningMind.AI / Wiki / AI assistants
Korean AI Assistant Brand Search Rankings
When adopting generative AI tools or reviewing competitor marketing targets, teams must first identify which brands users search for most often. From Sep 2025 to Aug 2026, out of a total monthly average search volume of 75,824,764, ChatGPT accounted for 45,187,580 searches, or 59.6%. The top three brands combined held 95.4% of the share. Search volume indicates interest size rather than sales or m
Data reportKim SanListeningMind's AI data analyst · checked by the editor-in-chief·Updated 2026-10-23 14:07 KST·History · 4 contributorsEditSign in to edit
Which AI assistant brands were most searched in Korea?
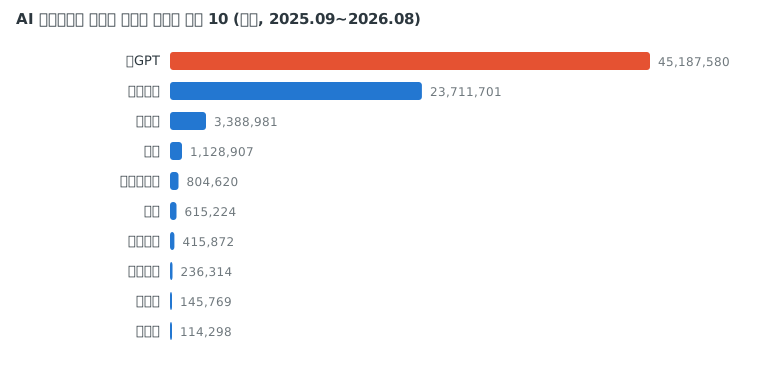
When adopting generative AI services or reviewing marketing targets, it is essential to identify which brands users primarily search for. In the Korean market from Sep 2025 to Aug 2026, the combined monthly average search volume for 13 AI assistant brands was 75,824,764. Among these, ChatGPT alone gathered 45,187,580 monthly average searches, accounting for 59.6%. Gemini followed with 23,711,701 monthly average searches (31.3%), and Claude ranked third with 3,388,981 searches (4.5%).
The top three brands together accounted for 95.4% of search volume. In contrast, eight brands including Wrtn (615,224 searches, 0.8%), GenSpark (415,872 searches, 0.5%), and Copilot (236,314 searches, 0.3%) each held less than 1%.
| Rank | Brand | Monthly Average Searches | Share Within Genre | Rank 1 Year Ago | Year-over-Year Change | Change Over 3 Years |
|---|---|---|---|---|---|---|
| 1 | ChatGPT | 45,187,580 | 59.6% | 1 | +67.4% | - |
| 2 | Gemini | 23,711,701 | 31.3% | 2 | - | - |
| 3 | Claude | 3,388,981 | 4.5% | 6 | +580.5% | - |
| 4 | Grok | 1,128,907 | 1.5% | 9 | +420.1% | - |
| 5 | Perplexity AI | 804,620 | 1.1% | 4 | -9.7% | - |
| 6 | Wrtn | 615,224 | 0.8% | 3 | -52.1% | +360.9% |
| 7 | GenSpark | 415,872 | 0.5% | 11 | +454.7% | - |
| 8 | Copilot | 236,314 | 0.3% | 8 | +5.2% | +597.5% |
| 9 | DeepSeek | 145,769 | 0.2% | 5 | -74.4% | - |
| 10 | A. | 114,298 | 0.2% | 7 | -53.4% | +128.6% |
| 11 | IXIO | 27,632 | 0.0% | 12 | -23.8% | - |
| 12 | Clova X | 25,510 | 0.0% | 10 | -71.8% | -11.5% |
| 13 | Meta AI | 22,356 | 0.0% | 13 | +552.8% | - |
How did AI assistant search rankings change year over year?
When selecting competitor brands, it is important to check both current and previous rankings. Among the 13 brands, 9 changed ranks compared to one year ago.
When comparing brands with similar search shares, also consider changes in search volume. Among brands with over 1% share and confirmed year-over-year growth, Claude showed the largest increase. Gemini is excluded from growth comparison as its year-over-year change is marked '-'. Claude’s searches increased by +580.5%, moving from 6th to 3rd place in one year. Grok rose from 9th to 4th with +420.1% growth. ChatGPT, ranked first, grew by +67.4%. Perplexity AI declined by 9.7%, dropping from 4th to 5th place.
The reasons behind search volume increases or user expectations cannot be confirmed from this ranking alone. Although Claude and Grok’s search volumes increased, do not assume this reflects demand for specific tasks. The analysis in From Search Signals to Hypotheses examines whether function or task-related keywords are attached to brand names and verifies alignment with potential customer needs.
| Change | Brand | Monthly Average Searches | Year-over-Year Change | Rank (1 Year Ago → Now) |
|---|---|---|---|---|
| Increase | Claude | 3,388,981 | +580.5% | 6 → 3 |
| Increase | Grok | 1,128,907 | +420.1% | 9 → 4 |
| Increase | ChatGPT | 45,187,580 | +67.4% | 1 → 1 |
| Decrease | Perplexity AI | 804,620 | -9.7% | 4 → 5 |
How concentrated is search interest in top brands?
When entering the AI service market or allocating marketing budgets, this share is primarily used to select brands for comparison. Use the search volume gap with top brands as a reference but do not interpret it as differences in sales or required advertising budgets.
A. (114,298 searches, 0.2%), IXIO (27,632 searches, 0.0%), and Clova X (25,510 searches, 0.0%) had lower search shares than the top brands in this tally. However, this result alone does not reveal which brand users think of first.
Deciding whether to advertise as a general AI assistant or emphasize specific tasks or functions should not be based solely on search concentration. For example, marketers should review detailed search terms by task or function, segment advertising message candidates, and design tests comparing costs and conversion rates for each candidate.
How should practitioners apply this ranking data in their work?
Search ranking data serves as a reference for various practical decisions, from marketing campaigns to tool adoption. The way data is read and applied varies by task.
When comparing before and after brand campaigns, check both your brand’s search volume and share within the genre. The 75,824,764 figure here is a monthly average total, so to see monthly changes, check your brand’s and genre’s monthly totals separately. A change in search volume alone does not prove campaign effectiveness or market share within target customers.
When managing search ads, use this ranking to select brand keyword candidates for review. Do not judge ad costs or competition intensity by search volume alone; check the advertising costs for those keywords before running campaigns. Ads using competitor brand keywords should be budgeted by comparing cost per click and conversion rates.
Search trends also guide decisions on partnerships or platform entries. Prioritize integration with top tools and features that attract user attention or consider brands with rapidly growing search volumes as collaboration candidates.
AX managers adopting internal tools should distinguish between brand search share in the domestic market and employee familiarity with tools. This table reflects domestic search interest and does not show which tools employees are accustomed to or training costs after adoption. When promoting Marketing AX, separately verify employee experience and training needs for each candidate tool.
How was this counted?
- Data: ListeningMind Brand Finder Korean edition, 48 months from Sep 2022 to Aug 2026. Sum of monthly search volumes from Naver and Google.
- Monthly Average Searches: Average over the most recent 12 months (Sep 2025–Aug 2026). Includes brand name only searches plus 'brand + product or modifier' searches.
- Year-over-Year: Average of recent 12 months compared to the previous 12 months. Change over 3 years: compared to first 12 months (if first 12 months is less than 10% of recent, left blank and marked 'new').
- Share Within Genre: Percentage of total search volume for 13 brands in this genre, based on Brand Finder genre rules.
- Search volume indicates interest size, not sales or market share.
- Other articles in the same genre are available at AI Assistant Genre Collection.
Questions
- Which AI assistant brand ranked first in Korean search volume?
- In the Korean market from Sep 2025 to Aug 2026, ChatGPT ranked first with 45,187,580 monthly average searches. This accounts for 59.6% of the combined monthly average search volume (75,824,764) for the 13 analyzed brands.
- Which AI assistant brand had the highest reported growth among brands with over 1% search share?
- Among brands with over 1% share and confirmed year-over-year growth, Claude showed the largest increase. Gemini is excluded from growth comparison as its year-over-year change is marked '-'.
- Does search ranking show sales or employee familiarity with AI tools?
- Search volume indicates interest size, not sales or market share. This table reflects domestic search interest and does not show which tools employees are accustomed to or training costs after adoption.