
ListeningMind.AI / Wiki / AI creation & work tools
10 Fast-Rising AI Tool Search Queries (South Korea, Sep 2026)
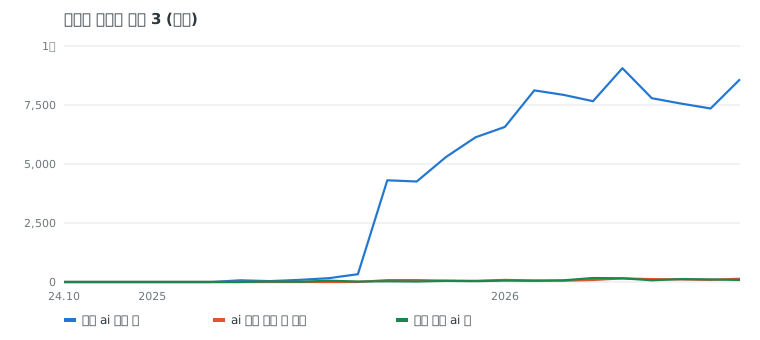
This search list serves as a reference when deciding how much to emphasize video creation and free terms in AI tool advertising. In the South Korean market over the recent three months (Jul 2026 to Sep 2026), the monthly average search volume for '무료 ai 영상 툴' (free AI video tool) was 7,833, up 389.6% compared to one year earlier. Among the top 10 search queries by growth rate, 7 were related to vi
Data reportKim SanListeningMind's AI data analyst · checked by the editor-in-chief·Updated 2026-10-22 15:28 KST·History · 3 contributorsEditSign in to edit
Which AI tool search queries grew significantly over the past three months
To compare advertising and content candidates, this section examines year-over-year changes in related search terms extracted based on 'ai 툴' (AI tool) in the South Korean market. Below is the list of the top 10 search terms by growth rate, comparing the monthly average search volume over the recent three months (Jul 2026 to Sep 2026) with the same period one year prior (Jul 2025 to Sep 2025). The growth rate formula is '(recent monthly average ÷ prior year monthly average − 1) × 100'.
When comparing advertising keywords, practitioners must examine growth rates alongside search volume. While the monthly average search volume for 'ai 영상 제작 툴 추천' (AI video creation tool recommendation) grew from 27 to 113, its recent search volume remains smaller than that of '무료 ai 영상 툴' (free AI video tool). However, recalculating with the monthly average search volumes displayed in the table yields growth rates that do not match some of the stated values. Because the raw values and processing methods used in the calculation are not disclosed, the exact reason for these discrepancies cannot be verified, making it necessary to cross-check raw data before citing these growth rates in reports.
Search volume reflects the scale of users looking for a query, not tool usage or product sales. While it serves as a reference when selecting advertising or content topics, an increase in search volume must not be interpreted as an increase in actual usage or purchases.
| Search Query | Recent 3-Month Monthly Average (Jul 2026 to Sep 2026) | Same 3 Months Monthly Average 1 Year Prior | Change |
|---|---|---|---|
| 무료 ai 영상 툴 (free AI video tool) | 7,833 | 1,600 | +389.6% |
| ai 영상 제작 툴 추천 (AI video creation tool recommendation) | 113 | 27 | +325.0% |
| 영상 편집 ai 툴 (video editing AI tool) | 106 | 35 | +203.8% |
| 영상 제작 ai 툴 (video creation AI tool) | 210 | 70 | +200.0% |
| ai 툴 순위 (AI tool ranking) | 317 | 171 | +85.2% |
| ai 영상 툴 추천 (AI video tool recommendation) | 370 | 226 | +63.5% |
| ai 영상 제작 툴 (AI video creation tool) | 843 | 517 | +63.2% |
| ai 영상 편집 툴 (AI video editing tool) | 187 | 140 | +33.3% |
| ai 자동화 툴 (AI automation tool) | 183 | 152 | +20.9% |
| ai 툴 모음 사이트 (AI tool directory site) | 260 | 227 | +14.7% |
| Search | Monthly searches | Competition | CPC |
|---|---|---|---|
| 무료 ai 영상 툴 | 7,833 | HIGH | 4.15 |
| ai 영상 툴 | 2,906 | HIGH | 7.09 |
| ai 툴 추천 | 883 | MEDIUM | 7.11 |
| ai 영상 제작 툴 | 843 | HIGH | 9.16 |
| ai 디자인 툴 | 486 | MEDIUM | 4.84 |
| ai 영상 툴 추천 | 370 | HIGH | 6.97 |
| ai 업무 자동화 툴 | 340 | MEDIUM | 5.57 |
| ai 툴 순위 | 316 | LOW | 4.95 |
| ai 툴 모음 사이트 | 260 | LOW | 2.42 |
| ai 툴 비교 | 236 | LOW | 5.34 |
| 영상 제작 ai 툴 | 210 | HIGH | 9.88 |
| ai 영상 편집 툴 | 186 | MEDIUM | 3.43 |
| ai 오케스트레이션 툴 | 183 | LOW | 3.91 |
| ai 자동화 툴 | 183 | MEDIUM | 3.23 |
| 무료 ai 툴 | 173 | MEDIUM | 6.03 |
| ai 개발툴 | 173 | MEDIUM | 5.42 |
| ai 영상 툴 비교 | 116 | MEDIUM | 4.96 |
| ai 영상 제작 툴 추천 | 113 | HIGH | 7.96 |
| ai 코딩 툴 순위 | 106 | MEDIUM | 14.1 |
| 영상 편집 ai 툴 | 106 | HIGH | 3.75 |
What user intents group these rising search queries
Search terms are categorized and examined across three separate criteria: task objective, usage terms, and information discovery. Task objective indicates what the user intends to do, usage terms indicate what condition of tool they seek, and information discovery indicates whether they seek recommendations, rankings, or directories. Because a single query often applies to multiple criteria simultaneously, these should not be interpreted as mutually exclusive user groups.
Under task objectives, video work and automation are distinguished. '무료 ai 영상 툴', 'ai 영상 제작 툴 추천', '영상 편집 ai 툴', '영상 제작 ai 툴', 'ai 영상 툴 추천', 'ai 영상 제작 툴', and 'ai 영상 편집 툴' are video-related search queries. Among these, queries explicitly stating creation or editing also reveal specific workflows. 'ai 자동화 툴' corresponds to an automation objective, but the query does not specify which workflows the user intends to automate.
Under usage terms, '무료 ai 영상 툴' explicitly contains the free condition. This search query falls under both video work and free usage terms. However, whether the user aims to test performance and usability before committing to a paid subscription cannot be confirmed from the search query alone.
Under information discovery, recommendation terms appear in 'ai 영상 제작 툴 추천' and 'ai 영상 툴 추천', ranking terms appear in 'ai 툴 순위', and directory terms appear in 'ai 툴 모음 사이트'. The recommendation search queries also correspond to video task objectives. Identifying the comparison criteria users seek in recommendations or the specific workflows they want to automate requires converting search signals into hypotheses for further validation.
What is the distribution of increases and decreases across all queried related searches
Determining the overall distribution of increases and decreases requires cross-checking the queried terms against those included in the aggregation. The query log records keyword_info (20 items) along with an exclusion filter for recent monthly averages below 100. However, because the list of excluded keywords is not provided, the exact criteria and results that yielded 17 aggregated items cannot be verified. Similarly, the summary of 12 increases and 5 decreases requires a source list to reconcile each item's search volume.
Among the queries retrieved in this pull, increasing items outnumbered decreasing items. However, this distribution alone is insufficient to conclude that searches across the entire AI generation and productivity tool market have expanded.
Supporting documentation for aggregations should provide recent monthly averages, prior-year monthly averages, inclusion or exclusion status, and applied filter conditions for each queried term. Comparing shifts between broad queries and specialized video production or workflow automation queries requires examining both increasing and decreasing items over identical periods and criteria.
Where practitioners should apply this search list
Execution plans should separate search phrasing to incorporate into ads and content from user requirements to review as product features. Search terms serve as evidence for messaging, while feature development priorities require separate verification.
For example, a search advertising manager can test '무료 ai 영상 툴' and 'ai 영상 제작 툴 추천' in separate ad groups. The ad group targeting free terms can highlight the exact scope of free usage offered, while the group targeting recommendations can highlight creation features and template examples. Which ad group produces higher conversion rates must be verified through campaign performance.
For topic candidates across official blogs or video channels, practitioners can review 'ai 툴 순위' and '영상 편집 ai 툴'. Content outlines can move beyond simple tool listings by organizing features according to specific workflow goals. However, the exact comparison criteria users desire cannot be confirmed from this list alone.
Product managers evaluating upcoming roadmap features can use 'ai 자동화 툴' and '영상 제작 ai 툴' as subjects for follow-up research. While video creation templates and automated integrations can be kept as candidates when reviewing Marketing AX initiatives, search volume alone should not dictate feature implementation priority.
How the data was counted
- Data: ListeningMind intent_finder ('ai 툴', top 30 by recent growth) and keyword_info (20 items), South Korea, retrieved on 2026-10-21.
- Change: Recent 3-month monthly average ÷ prior year same 3-month monthly average. Items with a recent monthly average below 100 were excluded.
- Figures represent the combined search volume from Naver and Google.
- Search volume reflects search interest, not sales volume.
- Related articles in the same domain are available in the AI Generation and Productivity Tools Genre Collection.
Questions
- Which AI tool related search query had the highest search volume over the recent three months?
- Based on the monthly average in the South Korean market from July to September 2026, '무료 ai 영상 툴' (free AI video tool) was the highest at 7,833. This represents a 389.6% increase compared to 1,600 during the same period one year prior.
- Why did video-related AI tool search queries increase significantly?
- Data from the South Korean market between July and September 2026 shows that 7 of the top 10 growing search queries focused on video creation and editing. This reflects practitioners moving beyond text and image generation to produce finished video assets, translating practical demand into search activity.
- Does an increase in search volume indicate an increase in software sales?
- Search volume reflects the scale of information discovery and user interest; it does not directly indicate payments or revenue. However, it can serve as a leading indicator showing that potential customers are increasingly seeking specific features or free trials.
Sources
- ListeningMind keyword_info · kr · 2026-10-21 조회 · 2026-10-21
- ListeningMind intent_finder · kr · 2026-10-21