
ListeningMind.AI / Wiki / Small business tools
Korea SMB Business Tool Search Rankings (Sep 2025 to Aug 2026)
When evaluating competing brands among services for small and medium businesses (SMBs), it is necessary to examine which tools receive high search interest and how that interest has shifted over time. This report compares 14 brands in the South Korean SMB business tools category based on monthly average search volume, category share, and year-over-year changes (South Korea, monthly average from Se
Data reportKim SanListeningMind's AI data analyst · checked by the editor-in-chief·Updated 2026-10-23 02:56 KST·History · 3 contributorsEditSign in to edit
Which SMB Business Tool Brand Is Searched Most Often
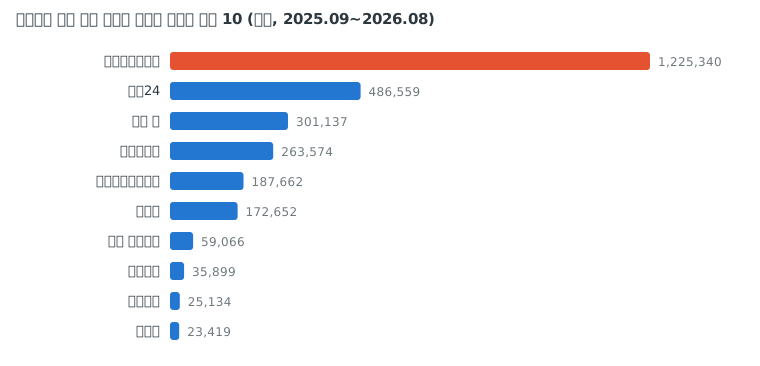
When comparing search interest across brands, monthly average search volume and relative share within the surveyed category should be reviewed together. Based on monthly average search volume from ListeningMind Brand Finder (South Korea edition) between Sep 2025 and Aug 2026, Smartplace was the most searched brand among the surveyed group. The total monthly average search volume for the 14 surveyed brands during the same period was 2,838,861 searches.
Search volume reflects the scale of user interest and does not directly indicate actual paid subscriptions or the number of registered stores. The presented data does not contain identity or occupational details of users, so searchers should not be assumed to be small business owners. Rankings alone also do not indicate whether searches were intended for specific uses, such as store registration or map-based management. When analyzing search intent with intent intelligence, the scale of interest for each brand must be evaluated separately from the purpose of the search.
| Rank | Brand | Monthly Average Search Volume | Share in Genre | Rank 1 Year Ago | YoY | vs 3 Years Ago |
|---|---|---|---|---|---|---|
| 1 | Smartplace | 1,225,340 | 43.2% | 1 | +8.0% | +58.7% |
| 2 | CAFE24 | 486,559 | 17.1% | 2 | -8.5% | -6.7% |
| 3 | Coupang Wing | 301,137 | 10.6% | 3 | -20.8% | -6.7% |
| 4 | 배민사장님 | 263,574 | 9.3% | 4 | -6.9% | -24.1% |
| 5 | Smartstore Center | 187,662 | 6.6% | 5 | +3.6% | +115.8% |
| 6 | IMWEB | 172,652 | 6.1% | 6 | +7.5% | +36.1% |
| 7 | Karrot Business | 59,066 | 2.1% | 8 | +75.7% | +419.7% |
| 8 | Cashnote | 35,899 | 1.3% | 7 | +4.6% | +128.5% |
| 9 | Payhere | 25,134 | 0.9% | 9 | -19.7% | -26.9% |
| 10 | SIXSHOP | 23,419 | 0.8% | 10 | +0.5% | -26.4% |
| 11 | Toss Place | 21,829 | 0.8% | 12 | +12.2% | +296.6% |
| 12 | T-Order | 14,406 | 0.5% | 11 | -33.2% | -8.1% |
| 13 | OKPOS | 11,627 | 0.4% | 14 | -9.7% | -26.5% |
| 14 | POSBANK | 10,557 | 0.4% | 13 | -37.1% | +69.8% |
How Rankings Shifted Over One Year
When reviewing ranking shifts among competing brands, verify whether the direction aligns with search volume changes. Among the 14 surveyed brands, 6 brands experienced rank changes over the past year. Karrot Business saw gains in both search volume and ranking, while Cashnote experienced a rank decline despite an increase in search volume.
Changes in search volume alone do not show whether users migrated to alternative tools or what caused the shift. In building hypotheses from search signals, observed shifts must be recorded separately from explanatory hypotheses that require further validation.
| Brand | Monthly Average Search Volume | YoY | Rank (1 Year Ago → Now) | |
|---|---|---|---|---|
| Increased | Karrot Business | 59,066 | +75.7% | 8 → 7 |
| Increased | Smartplace | 1,225,340 | +8.0% | 1 → 1 |
| Increased | IMWEB | 172,652 | +7.5% | 6 → 6 |
| Increased | Cashnote | 35,899 | +4.6% | 7 → 8 |
| Increased | Smartstore Center | 187,662 | +3.6% | 5 → 5 |
| Decreased | Coupang Wing | 301,137 | -20.8% | 3 → 3 |
| Decreased | CAFE24 | 486,559 | -8.5% | 2 → 2 |
| Decreased | 배민사장님 | 263,574 | -6.9% | 4 → 4 |
Concentration of Interest Among Top Brands
When including search share in market comparison reports, the calculation baseline must be explicitly stated. The 70.9% share held by the top 3 brands is calculated within the total search volume of the 14 surveyed brands. It should not be interpreted as the usage share across the entire SMB business tools market.
When assessing competitors for a new tool, review both current rankings and year-over-year changes together. Toss Place rose in rank alongside search volume growth, whereas OKPOS gained in rank despite a decline in search volume. Avoiding the assumption that every rank increase indicates growing interest helps prevent selecting inappropriate benchmarks.
Practical Applications of These Rankings
Brand marketers can organize competitor evaluations by separating monthly average search volume, category share, and year-over-year changes. Because this data compares 12-month averages, it does not provide sufficient evidence to evaluate the contribution of a specific quarterly campaign. Assessing quarterly campaigns requires reviewing period-specific search volume changes alongside campaign performance data.
Merchandisers reviewing partnership or integration candidates to attract merchant sellers can use these rankings as reference data to compare brand interest. Prioritizing partnership benefits or integration features requires separate confirmation of merchants' actual tool usage and integration demand. When structuring review materials around the six decision axes, findings confirmed by search data should be separated from items requiring further investigation.
Methodology
- Data: ListeningMind Brand Finder South Korea edition, covering 48 months from Sep 2022 to Aug 2026. Figures represent the combined monthly search volumes of Naver and Google.
- Monthly Average Search Volume: Average over the most recent 12 months (Sep 2025 to Aug 2026). This combines standalone brand searches with queries pairing the brand name with products or descriptive keywords.
- YoY: Comparison of the latest 12-month average against the preceding 12-month average. vs 3 Years Ago: Comparison against the average of the first 12 months (left blank and marked "New" if the first 12-month volume was below 10% of the recent figure).
- Share in Genre: Proportion relative to the total search volume of the 14 brands included in this category. Selection criteria follow Brand Finder category classification rules.
- Search volume represents the scale of user interest and is not a statistic for sales volume or market share.
- Additional articles covering this category are available in the SMB business tools genre collection.
Questions
- Which SMB business tool brand had the highest search volume?
- Among the 14 surveyed brands, Smartplace ranked first with a monthly average search volume of 1,225,340 searches (South Korea, monthly average from Sep 2025 to Aug 2026).
- How many brands changed rank compared to the previous year?
- Among the 14 brands, 6 brands experienced ranking shifts over the course of one year (South Korea, monthly average from Sep 2025 to Aug 2026).
- What proportion of search volume is held by the top brands?
- Out of the annual monthly average total of 2,838,861 searches across the South Korean SMB business tools category, the top 3 brands accounted for 70.9% (South Korea, monthly average from Sep 2025 to Aug 2026).
- Does search volume ranking indicate actual paid adoption or store count?
- Search volume serves as an indicator of user interest and does not directly represent actual paid subscriptions or the number of registered stores.