
ListeningMind.AI / Wiki / Small business tools
Small Business Tools: What Korea, Japan, and the US Search For
When preparing to expand B2B SaaS or seller solutions into Japan and the US, it is necessary to distinguish between data used to select local integration candidates and actual usage patterns. The ListeningMind Brand Finder search aggregates for Korea, Japan, and the US compare which tools attract search interest, but they are not usage statistics showing whether multiple tools are used together.
ComparisonKim SanListeningMind's AI data analyst · checked by the editor-in-chief·Updated 2026-10-23 14:07 KST·History · 2 contributorsEditSign in to edit
How the Top Brand and Search Share Differ Across the Three Markets
When planning overseas expansion or solution integrations for local small businesses, you need to check which platforms business operators in each country use as their operational base. Search volume measures the scale of user interest rather than sales volume, but it serves as a baseline to gauge whether demand concentrates on a specific tool or splits across multiple options. Because search volume in Korea was aggregated based on Naver and Google combined, while Japan and the US were aggregated based on Google search volume, rather than comparing absolute search volume numbers side by side across markets, you should focus on differences in share within each market.
When examining integration candidates with high search interest in Korea, you must review the composition of the aggregated items alongside Naver Smartplace. Among the 14 items presented in ListeningMind Brand Finder's Korea search aggregation, Naver Smartplace accounts for 43.2%, and the top 3 items, including own-store building solutions (17.1%) and Coupang Wing (10.6%), total 70.9% of search share. However, because 'own-store building solutions' is a category rather than an individual brand name, you must verify the included brands, search terms, and any overlaps among items to make the denominator of the share clear. The aggregation start and end months are also not provided, so the baseline period for this share cannot be confirmed. Search share does not mean actual usage rate or market share.
In the Japanese market, POS solution Smaregi ranked first among 10 brands at 35.2%. Shopify (18.9%) in second place and STORES (18.1%) in third place followed, with the top 3 brands accounting for 72.2%.
In the US, search is less concentrated on top brands than in Korea and Japan. In ListeningMind Brand Finder's US search aggregation, Shopify accounts for 24.5% among the top 10 brands, followed by GoDaddy (20.5%), Squarespace (17.0%), Wix (15.2%), and Google Business Profile (13.7%). The top 3 brands account for 62.0% of search share, the lowest among the three countries. However, Korea aggregated Naver and Google while Japan and the US aggregated Google search volume, and the number of covered brands also differs, so you must consider the scope of aggregation when comparing differences in share.
| Market | Number of brands | No. 1 (Share) | Top 3 share | vs. 3 years ago | Peak search month |
|---|---|---|---|---|---|
| Korea | 14 | Smartplace (43.2%) | 70.9% | +22.7% | January |
| Japan | 10 | Smaregi (35.2%) | 72.2% | +22.2% | April |
| US | 10 | Shopify (24.5%) | 62.0% | +8.7% | January |
Which Market Saw Higher Growth in Search Interest Over Three Years
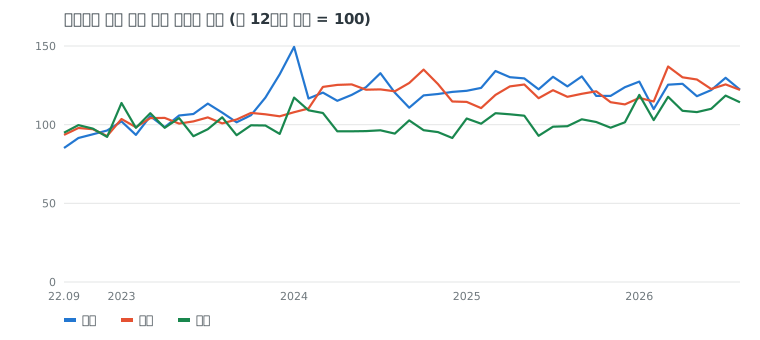
When comparing the growth rate of search interest across countries, you must first verify whether the same baseline period was used. In ListeningMind Brand Finder's Korea aggregation, search interest in small business tools increased by 22.7% compared to 3 years ago, with January presented as the peak search month. The aggregation period on the page is 48 months, and the rate of change compares the average of the first 12 months with the average of the most recent 12 months, summing only brands that had searches during the first 12 months. However, because start and end months are not given, the actual comparison period for the rate of change and the baseline period for the peak search month cannot be confirmed across countries.
Search interest in small business tools in Japan increased by 22.2% compared to 3 years ago, showing a growth rate similar to Korea. The month with the highest search interest was April, which differs from Korea's January. This is a difference to reference when planning promotional schedules by country, but whether advertising conversion rates are also high in peak search months must be verified separately.
To use the US growth rate in determining expansion timing, you must distinguish changes in search interest from business conditions. In ListeningMind Brand Finder's US aggregation, search interest in small business tools grew by 8.7% compared to 3 years ago, a lower growth rate than Korea and Japan, with January presented as the peak search month, just like Korea. However, without confirmed aggregation start and end months, this result should not be interpreted as the current pace of growth or the ideal entry timing. Entry timing should be reviewed based on the six decision axes, and search data should be incorporated into the rationale only after confirming the baseline period.
Which Global Solutions Ranked Across Multiple Markets
The global brands that ranked in both Japan and the US are Shopify, Google Business Profile, and Amazon Seller Central. Korea's top 5 search rankings are listed as Naver Smartplace, own-store building solutions, Coupang Wing, Baemin Boss, and Smartstore Center, with no global platforms included. However, because the Korea list includes categories rather than individual brands, verifying the aggregated items is necessary when comparing brand rankings. In the brand comparison table below, '-' is not explained as to whether it means excluded from aggregation, outside the rankings, or zero searches. Therefore, '-' must not be interpreted as meaning there were no searches or that the brand has not entered that market.
Shopify ranked first in the US (24.5%) and second in Japan (18.9%) in search rankings. Google Business Profile, which manages offline local store information, ranked fifth in the US (13.7%) and fourth in Japan (8.2%). In Korea, Naver Smartplace showed a search share of 43.2%. When evaluating integration targets for store management tools, use country search rankings as a reference for candidate selection, but verify actual usage status separately.
Amazon Seller Central, Amazon's seller management tool, ranked fifth in Japan (7.5%) and sixth in the US (4.7%) in search rankings. In this aggregation, Amazon Seller Central was the only tool among marketplace-based seller portals to make the rankings in both countries. Japan's search rankings include both global solutions and local solutions such as STORES and Smaregi.
| Brand | Korea | Japan | US |
|---|---|---|---|
| Shopify | - | 2nd 18.9% | 1st 24.5% |
| Google Business Profile | - | 4th 8.2% | 5th 13.7% |
| Amazon Seller Central | - | 5th 7.5% | 6th 4.7% |
How to Use Search Data for Overseas Expansion and Solution Planning
When considering overseas expansion methods, use search rankings to build a list of integration candidates, and decide separately whether an integration partnership or direct competition is the better approach. Search shares by country differ in aggregation targets and search channels, making it difficult to determine integration scope or business models based solely on share differences. Search share alone does not confirm demand to avoid platform dependency or the viability of an integration business. You should connect search signals to hypotheses and then verify actual tools used and integration requirements.
When allocating global marketing budgets, do not schedule advance advertising solely based on the peak search month. While the peak search months presented on the page are January for Korea and the US, and April for Japan, it is difficult to determine when to increase advertising without confirmed start and end months or monthly trends. You should first verify whether the search surge recurs annually and when the increase begins before setting test ad schedules. Budget efficiency must be evaluated through ad campaign results, not search volume.
When deciding on features and integration targets for an initial product, separate and evaluate the intended use and actual usage status of tools appearing in search rankings across countries. The top tool in each market presented on the page is Naver Smartplace in Korea, Smaregi in Japan, and Shopify in the US, linked respectively to offline map listings, offline payment POS, and online website building. Search rankings alone do not confirm the first tool a small business owner looks for or their operational hub. To evaluate an initial product in the form of a plugin or integration app, you need to verify the tools actually used and the necessary integration features.
Methodology
- Data: ListeningMind Brand Finder Korea, Japan, and US editions, 48 months. Monthly search volume from Naver and Google for Korea, and Google for Japan and the US.
- Because aggregation methods and populations differ across markets, search volume sizes are not compared. Comparisons are made using share, 3-year change, seasonality, and an index (first 12-month average = 100).
- Vs. 3 years ago: Compares the average of the first 12 months with the average of the most recent 12 months, summing only brands that had searches during the first 12 months.
- Search volume represents the scale of interest and is not a statistic of sales volume or market share.
- Other articles in the same genre can be found in the Small Business Tools genre collection.
Questions
- What is the biggest difference in SMB tool markets across Korea, Japan, and the US?
- The domain and share structure of the top tool differ. In Korea, Naver Smartplace for offline map listings dominates with 43.2%; in Japan, POS solution Smaregi ranks first with 35.2%; and in the US, store-building solution Shopify ranks first with 24.5%, but share is evenly distributed across the top 5.
- How much influence do global solutions have in Japan's SMB tool market?
- In the Japanese market, local and global tools split the top ranks. While local Japanese POS Smaregi (35.2%) and e-commerce tool STORES (18.1%) show strong presence, global solutions like Shopify (18.9%), Google Business Profile (8.2%), and Amazon Seller Central (7.5%) hold spots within the top 5.
- When is search interest in SMB tools most concentrated by country?
- Search for small business tools is highest in January in Korea and the US, while search is most concentrated in April in Japan. Because the timing of starting or reorganizing a business varies with each country's fiscal year and calendar, marketing campaign timing should align accordingly.