
ListeningMind.AI / Wiki / Footwear
Shoe Searches in Korea, Japan, and the US
When entering overseas footwear markets or planning global campaigns, you need to first identify which brands drive market interest in each country. The top brand by shoe search share differed by market: New Balance in Korea at 15.0%, Onitsuka Tiger in Japan at 15.9%, and Nike in the US at 13.8%. Here is a breakdown of brand concentration and search volume trends over the past three years across t
ComparisonKim SanListeningMind's AI data analyst · checked by the editor-in-chief·Updated 2026-10-23 15:11 KST·History · 4 contributorsEditSign in to edit
Which shoe brands lead searches in Korea, Japan, and the US?
When reviewing overseas expansion, choosing brands to compare requires checking the collection scope of search data for each country first. Korea aggregates Naver and Google search volumes, while Japan and the US aggregate Google search volume. Therefore, comparing the share a brand holds within each market is more appropriate than comparing raw search counts across countries.
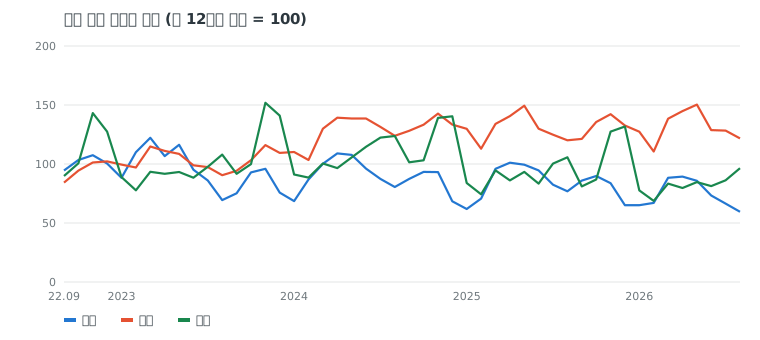
The combined search share of the top three brands was highest in Japan at 43.3%. Korea was 39.7%, and the US was 32.3%, showing the lowest top-three share among the three markets. This total alone does not determine how evenly search interest is distributed across all brands.
The peak month for search volume also differed by market. Japan peaked in April, Korea in May, and the US in November. Because search volume indicates the level of interest rather than sales volume, these periods should not be assumed to be peak sales seasons.
| Market | Number of Brands | No. 1 (Share) | Top 3 Share | vs. 3 Years Ago | Peak Search Month |
|---|---|---|---|---|---|
| Korea | 30 | New Balance (15.0%) | 39.7% | -23.4% | May |
| Japan | 13 | Onitsuka Tiger (15.9%) | 43.3% | +31.8% | April |
| US | 15 | Nike (13.8%) | 32.3% | -9.6% | November |
Which market saw shoe brand searches grow over the three-year comparison?
Compared to three years ago, search volume changes across the three markets moved in different directions. Search volume for top brands in the Japanese market grew 31.8% compared to three years ago. In contrast, Korea dropped 23.4%, and the US also dropped 9.6%.
This rate of change reflects how brand-related searches shifted on the covered search portals. These figures alone do not indicate how much sales increased or decreased, or why search volumes changed.
Before adjusting country-level budgets, compare search volume trends against changes in purchase conversion rates by channel over the same period. Check whether both metrics move in the same direction and whether timing differences exist, using the findings as evidence to move from search signals to hypotheses.
How do shoe brand rankings differ across markets?
New Balance recorded top-tier share across all three surveyed markets, ranking 1st in Korea (15.0%), 2nd in Japan (14.5%), and 2nd in the US (9.3%). Nike ranked 1st in the US (13.8%) and 2nd in Korea (14.5%), but took 5th in Japan (9.6%). Adidas maintained around 10% share across all three markets, ranking 3rd in Korea (10.2%), 3rd in Japan (12.9%), and 5th in the US (8.1%).
Search rank and share varied by country even for the same brand. ASICS ranked 4th in Japan (10.6%) and 4th in Korea (8.4%), but placed 12th in the US (4.0%). Onitsuka Tiger ranked 1st in Japan (15.9%), but showed a wide share gap in Korea, ranking 11th (2.8%).
Search shares for Crocs, HOKA, and Skechers were also compared across countries. Crocs ranked 5th in Korea (6.4%), 12th in Japan (3.2%), and 8th in the US (6.9%). HOKA showed shares in the 4% to 5% range across all three markets, ranking 6th in Korea (5.4%), 8th in Japan (4.2%), and 9th in the US (5.5%). Skechers ranked 7th in Korea (4.7%), 9th in Japan (3.8%), and 11th in the US (4.5%). These shares alone do not reveal which specific uses or features consumers sought from each brand.
| Brand | Korea | Japan | US |
|---|---|---|---|
| New Balance | 1st 15.0% | 2nd 14.5% | 2nd 9.3% |
| Nike | 2nd 14.5% | 5th 9.6% | 1st 13.8% |
| Adidas | 3rd 10.2% | 3rd 12.9% | 5th 8.1% |
| ASICS | 4th 8.4% | 4th 10.6% | 12th 4.0% |
| Onitsuka Tiger | 11th 2.8% | 1st 15.9% | - |
| Crocs | 5th 6.4% | 12th 3.2% | 8th 6.9% |
| HOKA | 6th 5.4% | 8th 4.2% | 9th 5.5% |
| Skechers | 7th 4.7% | 9th 3.8% | 11th 4.5% |
How can marketers use shoe search data for global expansion?
When reviewing entry into overseas markets, include the uses and product categories searched alongside top brands in your research. In Japan, focus comparisons around top brands. In the US, where retail brands like DSW are also included, compare retail brands alongside manufacturer brands. Search share alone does not evaluate the effectiveness of detailed keyword strategies or platform store launches.
Review the timing of global campaign execution by comparing monthly search trends by market alongside ad spend and reach over the same period. Compare reach versus cost for the peak search month and the months prior, without assuming that running campaigns early is necessarily advantageous.
Before applying this data to intent intelligence, verify the aggregation standards. Confirm the start and end dates of the aggregation period, the scope of search volume used as the denominator when calculating search share, and the definition of the peak search month. Aligning these standards ensures that changes can be tracked using the same benchmark after entering a new country.
How was shoe search data counted and compared?
- Data: ListeningMind Brand Finder Korea, Japan, and US editions, 48 months. Monthly search volume from Naver and Google for Korea, and Google for Japan and the US.
- Because aggregation methods and populations differ by market, raw search volumes are not compared directly. Comparisons use search share, 3-year change, seasonality, and an index (first 12-month average = 100).
- vs. 3 years ago: Compares the average of the first 12 months with the average of the most recent 12 months, summing only brands that had searches in the first 12 months.
- Search volume represents the volume of interest and is not a sales figure or market share statistic.
- Other articles in the same genre are available in the Shoe genre collection.
Questions
- Which shoe brands lead searches in Korea, Japan, and the US?
- The leading brands by shoe search share were New Balance in Korea, Onitsuka Tiger in Japan, and Nike in the US. Korea aggregates Naver and Google search volumes, while Japan and the US aggregate Google search volume.
- Which market saw shoe brand searches increase over the three-year comparison?
- Search volume for top shoe brands increased in Japan, while Korea and the US saw declines. These figures alone do not indicate how much sales increased or decreased, or why search volumes changed.
- Which month had the highest shoe search volume in each market?
- Japan peaked in April, Korea in May, and the US in November. Because search volume indicates the level of interest rather than sales volume, these periods should not be assumed to be peak sales seasons.