
ListeningMind.AI / Wiki / Footwear
How Does Search Interest Differ for Skechers and Le Mouton?
When deciding search ad messaging for Skechers and Le Mouton, comparing co-searched terms alongside overall search volume is necessary. Over the past year (Sep 2025 to Aug 2026, South Korea, shoes category), monthly average search volume reached 633,763 for Skechers and 618,820 for Le Mouton. Skechers co-searches include functional line names such as Go Walk, Max Cushioning, and Arch Fit, while Le
ComparisonKim SanListeningMind's AI data analyst · checked by the editor-in-chief·Updated 2026-10-23 22:15 KST·History · 3 contributorsEditSign in to edit
Who Was Searched More Often
When setting ad messaging, search scale and rank serve as grounds for comparing the volume of brand interest, not for deciding which information to highlight. According to ListeningMind Brand Finder data for the shoes category in South Korea from Sep 2025 to Aug 2026, monthly average search volume was 633,763 for Skechers and 618,820 for Le Mouton. In the same period, share and rank within the category placed Skechers 7th at 4.7% and Le Mouton 8th at 4.6%. One year prior, Skechers ranked 8th and Le Mouton ranked 7th, trading positions during this aggregation window. Whether to split messaging should be evaluated by looking at co-searched terms for each brand rather than rank changes.
Even if key search demographic groups are similar, assuming the same ad messaging will be effective is difficult. In ListeningMind Brand Finder data for the shoes category in South Korea from Sep 2025 to Aug 2026, women make up the majority for both brands, with those aged 50 and older representing the largest age bracket. For Skechers, the female share is 61.7% and the share of users aged 50 and older is 34.8%, while for Le Mouton the figures are 69.0% and 39.4%, respectively. Rather than unifying messaging based solely on gender and age, verifying plans to segment messaging by co-searched information is needed. Differences in user demographics should not be assumed to have caused the differences in information sought, however. Search user demographics differ from purchasing customer demographics, and search volume does not indicate direct product sales.
| Skechers | Le Mouton | |
|---|---|---|
| Monthly average search volume | 633,763 | 618,820 |
| Category rank (1 year ago) | 7 (8) | 8 (7) |
| Category share | 4.7% | 4.6% |
| Year over year | +0.2% | -20.5% |
| vs. 3 years ago | +4.2% | +463.3% |
| Female share | 61.7% | 69.0% |
| Top age group | 50 and older 34.8% | 50 and older 39.4% |
How Do Co-Searched Terms Differ
Searches for Skechers functional line names provide grounds to check whether sufficient information about those lines is being offered. In ListeningMind Brand Finder data for the shoes category in South Korea from Sep 2025 to Aug 2026, Skechers related search queries include item terms such as sneakers and sandals, alongside functional line names such as Go Walk, Max Cushioning, and Arch Fit. Following the most searched query, 'Skechers sneakers' (110,474), come 'Skechers Go Walk' (35,446), 'Skechers Max Cushioning' (26,778), 'Skechers sandals' (26,243), 'Skechers Arch Fit' (23,530), and 'Skechers USA' (17,442). The hypothesis to verify is whether descriptions of the searched product lines match the information users were looking for. The fact that a line name was searched does not confirm a preference for that feature.
Searches for Le Mouton store locations and prices provide grounds to review whether store and pricing information is easy to check alongside product information. In ListeningMind Brand Finder data for the shoes category in South Korea from Sep 2025 to Aug 2026, 'Le Mouton sneakers' recorded 168,302 searches, higher than Skechers sneakers, while 'Le Mouton store' was second highest at 44,464. These were followed by 'Le Mouton Mary Jane' (20,576), 'Le Mouton shoes' (19,551), 'Le Mouton sneakers price' (8,668), and 'Le Mouton Mate' (6,164). Distinguishing searches for product names from searches for store and price information (intent intelligence) helps verify whether users easily find the necessary details on the respective landing pages. Searching for store locations or prices does not establish an intent to visit or buy.
| Terms co-searched with Skechers | Terms co-searched with Le Mouton | |
|---|---|---|
| 1 | Skechers sneakers (110,474) | Le Mouton sneakers (168,302) |
| 2 | Skechers Go Walk (35,446) | Le Mouton store (44,464) |
| 3 | Skechers Max Cushioning (26,778) | Le Mouton Mary Jane (20,576) |
| 4 | Skechers sandals (26,243) | Le Mouton shoes (19,551) |
| 5 | Skechers Arch Fit (23,530) | Le Mouton sneakers price (8,668) |
| 6 | Skechers USA (17,442) | Le Mouton Mate (6,164) |
How Search Trends Diverged Between the Two Brands
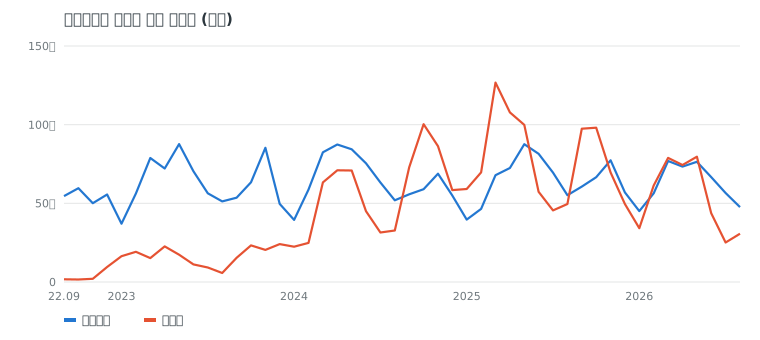
When determining whether search interest increased, establishing a comparison window is the first step. For the same brand, year-over-year and vs. three years ago comparisons reflect changes across different timeframes. In ListeningMind Brand Finder data for the shoes category in South Korea from Sep 2025 to Aug 2026, monthly average search volume for Skechers grew +0.2% year over year and rose +4.2% compared to three years ago.
For Le Mouton, the direction of change varies depending on the comparison period, so summarizing search interest as rising or falling based on a single timeframe overlooks changes during other intervals. In ListeningMind Brand Finder data for the shoes category in South Korea from Sep 2025 to Aug 2026, monthly average search volume for Le Mouton grew 463.3% compared to three years ago, but declined 20.5% year over year.
Differences between period averages alone do not indicate whether searches concentrated at a particular point in time or what caused them to increase or decrease. Therefore, this comparison should not be interpreted as evidence of growth causes or a market adjustment phase.
What This Comparative Data Can Inform
In advertising, verifying whether guidance tailored to search terms delivers the information users were looking for is essential. For instance, brand marketers can consider linking information on specific product lines to searches for Skechers Go Walk, Arch Fit, and Max Cushioning, while linking appropriate information to Le Mouton searches for 'store' and 'price.' What needs verification is whether the search ad message aligns with the landing page content and whether users can easily locate the searched details on that page. This is the process of turning search signals into hypotheses, not confirming purchasing stages or intent to inspect physical products based solely on search queries.
When product planners select research items for upcoming products, they review item names and product lines in related search terms. Survey plans can investigate what details users intended to find when searching for Skechers sandals, Go Walk, Max Cushioning, and Arch Fit, or Le Mouton Mary Jane and Mate. This list serves as a reference organizing search interest (Marketing AX), and search terms alone do not determine product expansion directions or inventory levels.
How Data Was Counted
- Data: ListeningMind Brand Finder Korea edition, 48 months from Sep 2022 to Aug 2026. Combined monthly search volume from Naver and Google.
- Monthly average search volume: Average over the recent 12 months (Sep 2025 to Aug 2026). Combines standalone brand name searches with 'brand + product or modifier' searches.
- Year over year: Comparison of the recent 12-month average with the previous 12-month average. vs. 3 years ago: Comparison with the first 12-month average (if the first 12-month figure is below 10% of the recent figure, it is left blank and marked as 'New').
- Category share: Percentage of the combined search volume for the 30 brands included in this category. Inclusion criteria follow Brand Finder category rules.
- Search volume represents the scale of interest and is not a statistic for sales volume or market share.
- Other articles in the same category can be found in the Shoes Category Collection.
Questions
- How do the primary search user demographics differ between the two brands?
- Based on search data in South Korea from Sep 2025 to Aug 2026, both brands show the highest proportions among women and those aged 50 and older. However, Le Mouton has slightly higher shares for women (69.0%) and users aged 50 and older (39.4%) than Skechers (61.7% women, 34.8% aged 50 and older).
- How have recent search volume trends changed for Le Mouton?
- Le Mouton grew substantially over the long term, with search volume rising +463.3% compared to three years ago. Over the recent year (Sep 2025 to Aug 2026), however, it decreased 20.5% year over year.
- What are the search volume ranks and shares of both brands within the shoes category?
- In the shoes category in South Korea from Sep 2025 to Aug 2026 on a monthly average basis, Skechers ranked 7th with a 4.7% share. During the same period, Le Mouton ranked 8th with a 4.6% share. One year earlier, Skechers ranked 8th and Le Mouton ranked 7th.
- What are the most searched terms associated with Skechers?
- Based on monthly averages in South Korea from Sep 2025 to Aug 2026, 'Skechers sneakers' was the most co-searched query at 110,474. It was followed by 'Skechers Go Walk' at 35,446, 'Skechers Max Cushioning' at 26,778, and 'Skechers sandals' at 26,243. Search volume reflects user interest, not sales volume.
- How did search volume change for both brands compared to three years ago?
- In South Korea from Sep 2025 to Aug 2026 on a monthly average basis, Skechers saw a +4.2% change compared to three years ago. During the same period, Le Mouton recorded a +463.3% change compared to three years ago. Monthly average search volume for that period was 633,763 for Skechers and 618,820 for Le Mouton.