
ListeningMind.AI / Wiki / AI topics
AI Search Trends: Vibe Coding Rose, AI Drawing Fell
When planning new AI services and annual campaigns, it is necessary to distinguish growing topics from tasks that still attract high search demand. AI Checker and Vibe Coding grew, yet despite the decline in searches for AI Drawing, 'ai image generation' remained the most frequent related search term. Feature planning should examine interest by task, while ad messaging and scheduling should be div
GuideKim SanListeningMind's AI data analyst · checked by the editor-in-chief·Updated 2026-10-24 12:57 KST·History · 2 contributorsEditSign in to edit
Which AI Topics Do People Search for the Most?
When preparing new campaigns or categorizing services, practitioners need to check which terms people actually pay attention to. Unlike survey responses, search data reflects the scale of demand voluntarily expressed by users. Search volume indicates the level of interest and does not represent actual product sales.
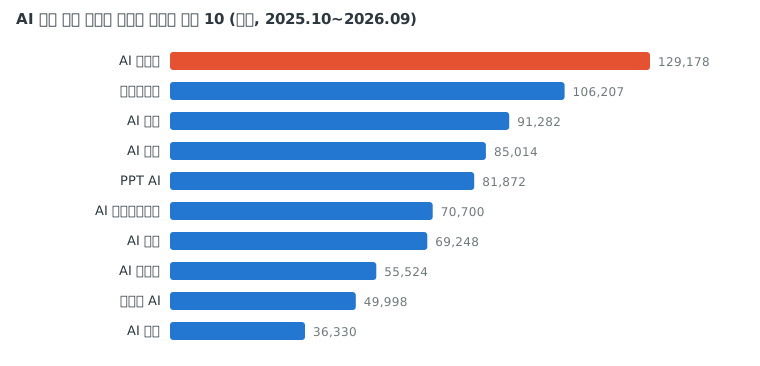
When reflecting AI topics of interest in service classifications, verification, development, and video production should be examined together. In the ListeningMind Brand Finder South Korea data (Oct 2025 to Sep 2026), AI Checker, Vibe Coding, and AI Video together accounted for 38.2% across 14 topics. Because users search for different tasks even among the top topics, it is better not to bundle service descriptions under a single generative feature. In the Brand Finder table, areas of interest like AI Checker and Vibe Coding are listed under the 'Brand' column; in this article, they are referred to as 'topics' to distinguish them from comparisons of actual corporate brands.
The data shows that the nature of the rankings changed substantially compared to one year ago. AI Checker, which ranked 6th one year ago, rose to 1st place with a 139.5% increase year over year. Vibe Coding, which was 8th, also rose to 2nd place with a 292.0% increase year over year. On the other hand, AI Digital Textbook, which was 1st one year ago, dropped to 6th place with 70,700 searches, accounting for 8.3% and declining 51.5% year over year. AI Drawing, which was 2nd, recorded 69,248 searches (8.1%), dropping 45.6% year over year to 7th place. Compared to three years ago, this represents a 76.4% decrease.
A notable shift for feature planning is the rise in searches for verification and development topics. In the ListeningMind Brand Finder South Korea data (Oct 2025 to Sep 2026), AI Checker increased by 139.5% year over year, and Vibe Coding grew by 292.0%, while AI Video, AI Song, and PPT AI also increased. This indicates that rather than interest in generative tools disappearing, interest in verification, development, and various production tools has grown alongside them. Rather than reducing generative features across the board, teams should separate verification and development features from production features to compare planning priorities.
| Rank | Brand | Monthly Average Search Volume | Share within Genre | Rank 1 Year Ago | YoY | vs. 3 Years Ago |
|---|---|---|---|---|---|---|
| 1 | AI Checker | 129,178 | 15.1% | 6 | +139.5% | - |
| 2 | Vibe Coding | 106,207 | 12.4% | 8 | +292.0% | - |
| 3 | AI Video | 91,282 | 10.7% | 4 | +38.3% | - |
| 4 | AI Song | 85,014 | 9.9% | 7 | +164.9% | +109.0% |
| 5 | PPT AI | 81,872 | 9.6% | 5 | +42.6% | - |
| 6 | AI Digital Textbook | 70,700 | 8.3% | 1 | -51.5% | - |
| 7 | AI Drawing | 69,248 | 8.1% | 2 | -45.6% | -76.4% |
| 8 | AI Semiconductor | 55,524 | 6.5% | 3 | -37.8% | -13.5% |
| 9 | Physical AI | 49,998 | 5.8% | 12 | +534.3% | - |
| 10 | AI Education | 36,330 | 4.2% | 10 | +128.1% | +716.9% |
| 11 | AI Glasses | 25,882 | 3.0% | 14 | - | - |
| 12 | AI Agent | 23,204 | 2.7% | 11 | +97.9% | - |
| 13 | AI Interview | 18,621 | 2.2% | 9 | -12.5% | -31.5% |
| 14 | AI Data Center | 12,812 | 1.5% | 13 | +191.1% | - |
Which Topics Surged or Declined Over the Past Year?
When reviewing annual business plans, repeating past success methods can lead to allocating resources in the wrong direction. Over the past year, rankings changed for 12 out of the top 15 brands, showing how much market interest has shifted.
When selecting growth topics, growth rate and current search scale must be distinguished. In the ListeningMind Brand Finder South Korea data (Oct 2025 to Sep 2026), Physical AI showed the highest year-over-year growth rate among the presented topics at 534.3%, yet it ranked 9th in monthly average search volume. This shows that emerging topics with high search growth rates differ from core topics with large absolute search volumes. It is advisable to use growth rates to pick experimental topics for new content, while deciding production scope and budget allocation by looking at search scale and actual performance together.
Conversely, areas that declined significantly are also clear. AI Digital Textbook saw the largest drop, decreasing 51.5% year over year. AI Drawing fell by 45.6%, and AI Semiconductor dropped by 37.8%. AI Interview, associated with recruitment processes, also declined 12.5% year over year to 18,621 searches, slipping from 9th to 13th. Compared to three years ago, this represents a 31.5% decline.
The decline in searches for AI Drawing should not be used as justification to reduce image-generation-related content. In the ListeningMind Brand Finder South Korea data (Oct 2025 to Sep 2026), AI Drawing fell 45.6% year over year, but in the related search terms table, 'ai image generation' was the most searched term with a monthly average sum of 49,199. Topic search volume changes and the scale of related search terms are different metrics; looking at both tables together shows that specific production demand remains even for declining topics. It is better to maintain image generation content while reviewing the priority of verification and development content separately.
| Brand | Monthly Average Search Volume | YoY | Rank (1 Year Ago → Now) | |
|---|---|---|---|---|
| Increase | Physical AI | 49,998 | +534.3% | 12 → 9 |
| Increase | Vibe Coding | 106,207 | +292.0% | 8 → 2 |
| Increase | AI Data Center | 12,812 | +191.1% | 13 → 14 |
| Increase | AI Song | 85,014 | +164.9% | 7 → 4 |
| Increase | AI Checker | 129,178 | +139.5% | 6 → 1 |
| Decrease | AI Digital Textbook | 70,700 | -51.5% | 1 → 6 |
| Decrease | AI Drawing | 69,248 | -45.6% | 2 → 7 |
| Decrease | AI Semiconductor | 55,524 | -37.8% | 3 → 8 |
| Decrease | AI Interview | 18,621 | -12.5% | 9 → 13 |
How Do AI Topics Differ by Age Group?
Whether targeting campaigns at people in their 20s or 40s, the product features and search keywords highlighted need to change. The age distribution for AI interest topics reveals distinct differences in the topics each generation focuses on.
When determining target messages for younger age groups, the most searched topic must be distinguished from topics that index higher than the overall average. In the ListeningMind Brand Finder South Korea data (Oct 2025 to Sep 2026), AI Checker accounted for 44.6% among those aged 13 to 19. Those aged 25 to 29 searched most for Vibe Coding, but the topic with the highest index relative to the average was AI Interview at 3.37x. The index relative to the average compares the search share of a topic within an age group against its overall average share. It is suitable to use topics with high search shares for broad campaigns and test topics with high indices as candidates for age-specific ad creatives.
Rather than bundling audiences in their 30s and 40s under the same production tool messaging, it is better to separate them into video and coding. In the ListeningMind Brand Finder South Korea data (Oct 2025 to Sep 2026), the top topic by search share within each group differed: AI Video (17.2%) for those in their 30s and Vibe Coding (14.7%) for those in their 40s. For people in their 40s, the topic with the highest index relative to the average was AI Digital Textbook, meaning priorities based on search share and age-specific characteristics must be evaluated separately. Ad creatives should distinguish between video production and coding, while testing education-related content as separate creative variations.
Even if overall searches declined for a topic, it may remain a high priority within a specific age group. In the ListeningMind Brand Finder South Korea data (Oct 2025 to Sep 2026), AI Semiconductor accounted for 6.5% across the entire genre, but it reached 18.8% among those aged 50 and older, making it their top topic. Rather than cutting AI Semiconductor content solely based on the overall decline rate, teams should evaluate engagement with semiconductor explanatory content aimed specifically at that age group.
| Age Group | Share of Genre Searches | Most Searched Brand (Share within Age Group) | Brand Searched More than Average (Index) |
|---|---|---|---|
| 13–19 | 16.9% | AI Checker (44.6%) | AI Checker (2.95x) |
| 20–24 | 11.0% | AI Checker (28.6%) | AI Interview (2.28x) |
| 25–29 | 11.4% | Vibe Coding (15.7%) | AI Interview (3.37x) |
| 30s | 22.3% | AI Video (17.2%) | AI Video (1.61x) |
| 40s | 21.8% | Vibe Coding (14.7%) | AI Digital Textbook (1.41x) |
| 50 and older | 16.6% | AI Semiconductor (18.8%) | AI Semiconductor (2.91x) |
Which Seasons See Concentrated AI Topic Search Demand?
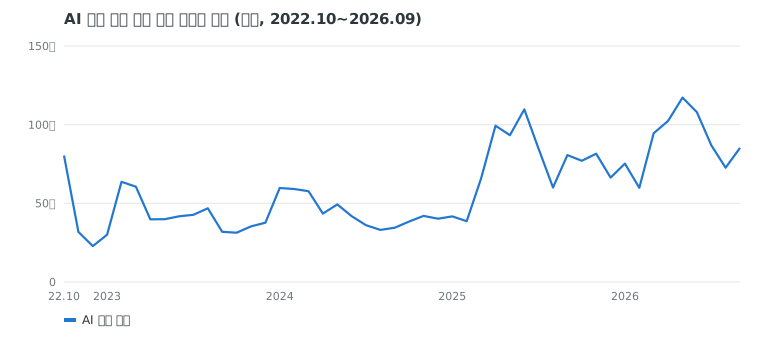
Distributing a budget evenly throughout the year risks missing exposure when demand spikes or wasting budget during off-peak periods. The seasonality index for AI topics in the South Korean market over the 48 months from October 2022 to September 2026 shows concentration in the first half of the year and a decline toward year-end.
When setting annual advertising schedules, months with past search concentration can serve as candidate periods for preparing content. In the ListeningMind Brand Finder South Korea data (Oct 2022 to Sep 2026), the seasonality index for the entire genre peaked in March at 116 and reached its lowest in December at 80. The overall genre table can be used to plan general preparation timelines, while actual execution timing should be decided by reviewing topic-specific indices below alongside recent monthly search volumes.
Because peak search timing for individual topics differs from the overall genre, campaign preparation schedules must also be separated. In the ListeningMind Brand Finder South Korea data (Oct 2022 to Sep 2026), the seasonality index for Physical AI peaked in January at 206, while AI Digital Textbook peaked in June at 151. Even within the same AI interest genre, the timing of concentrated searches varies by subtopic. Content for Physical AI and AI Digital Textbook should be reviewed under different preparation timelines, and ad execution adjusted according to recent search trends and actual performance.
| Month | AI Interest Topics Genre | Physical AI | AI Digital Textbook |
|---|---|---|---|
| Jan | 99 | 206 | 42 |
| Feb | 90 | 90 | 28 |
| Mar | 116 | 82 | 67 |
| Apr | 113 | 52 | 122 |
| May | 114 | 53 | 141 |
| Jun | 115 | 36 | 151 |
| Jul | 97 | 81 | 122 |
| Aug | 87 | 67 | 77 |
| Sep | 85 | 88 | 95 |
| Oct | 84 | 63 | 72 |
| Nov | 88 | 154 | 79 |
| Dec | 80 | 73 | 68 |
What Search Terms Do Users Pair with AI Searches?
When drafting ad copy or product detail pages, a clear difference emerges between technical terms used by practitioners and words entered into search boxes by consumers. Checking search terms commonly attached to the top 20 brands reveals the specific tasks users intend to solve with AI.
The related search terms table should be used independently from the topic ranking table to select ad keywords and content titles. In the ListeningMind Brand Finder South Korea data (Oct 2025 to Sep 2026), the related search terms table is presented as the 'Monthly Average Total for Top 20 Brands', and its aggregation scope is described differently from the earlier 14-topic search volume table. Therefore, rather than summing the search volumes of both tables or converting them into shares of the same population, teams should reflect the tasks revealed in related search terms into page structures.
Production-related pages are better structured by presenting the desired output before the technology name. In the ListeningMind Brand Finder South Korea data (Oct 2025 to Sep 2026), specific outputs and production actions appear together in search terms such as 'ai that makes ppt', 'ai video production', and 'making ai video'. Structuring detail page titles and descriptions by output and comparing traffic and conversions against technology-centric pages is recommended.
Because searches include detection and investment purposes in addition to production, content must be divided by intent. In the ListeningMind Brand Finder South Korea data (Oct 2025 to Sep 2026), the monthly average total of related searches was 32,205 for 'ai detector' and 48,830 for 'ai-related stocks'. Matching search terms to page intent involves connecting instructions to detector searches and investment-related information to stock searches. Using specific tasks like 'PPT creation', 'video production', and 'detection' in detail page titles and ad keywords allows teams to compare actual traffic and conversions.
| Words Searched Along with Brand | Monthly Average Total for Top 20 Brands |
|---|---|
| ai image generation | 49,199 |
| ai-related stocks | 48,830 |
| ai that makes ppt | 39,540 |
| ai video production | 32,288 |
| ai detector | 32,205 |
| making ai video | 26,974 |
| ai competency assessment | 13,097 |
| ai lectures | 9,529 |
| ai cover | 9,142 |
| ai drawing pictures | 988 |
How Can This Search Data Connect to Decision-Making and Automation?
Relying solely on quarterly reports for market research makes it difficult to respond swiftly to market changes. Collected search data can serve as reference material supporting internal corporate decision-making and operational systems. For this purpose, integrating an API, MCP, and Skills can be evaluated.
Search data automation is an optional application, and the figures on this page do not prove the necessity of system construction. When connecting Brand Finder data to enterprise marketing AX, search scale, growth rates, age shares, and monthly indices should be managed alongside source, market, and collection period. An API as an interface to transfer data between programs, MCP as a protocol enabling AI to connect and use external tools and data, and Skills packaging instructions for repetitive tasks are options to connect based on operational needs. If adopting automation, teams should first build workflows to periodically gather and review metrics, designing bid and budget adjustments as separate rules evaluated alongside actual ad performance.
Before follow-up analysis, aggregation criteria across tables must be supplemented in the methodology. The ranking and change tables cover the 14 topics presented in the text, but the 'top 15' in the rank change description and the 'top 20' in the related search terms table do not list target entities, so their inclusion relationship cannot be confirmed. While monthly average search volume is described as the sum of standalone brand searches and searches with modifiers, the deduplication criteria for overlapping keywords across topics and related search totals are not specified. It should also be stated whether the age and seasonality index tables cover the same scope of topics. Because the seasonality index lacks an explanation of how the baseline 100 was derived and whether long-term upward or downward trends were adjusted, it should not be used as definitive proof of recurring peak seasons. Since search volume reflects interest and does not prove user professions, pain points, or wasted advertising spend, assumptions such as AI Checker being used for homework verification or AI Video for work production should remain hypotheses to test in interviews.
How We Counted
- Data: ListeningMind Brand Finder South Korea edition, 48 months from Oct 2022 to Sep 2026. Combined monthly search volume from Naver and Google.
- Monthly average search volume: Average over the most recent 12 months (Oct 2025 to Sep 2026). Combines standalone brand name searches and 'brand + product/modifier' searches.
- YoY: Comparison between the most recent 12-month average and the preceding 12-month average. vs. 3 years ago: Comparison with the first 12-month average (left blank and marked 'New' if the first 12-month value was under 10% of the recent value).
- Share within genre: Percentage relative to the total search volume of the 14 brands included in this genre. Inclusion follows Brand Finder genre classification rules.
- Search volume indicates level of interest, not sales figures or market share statistics.
- Related articles in the same genre can be found in the AI Topics Genre Collection.
Questions
- What is the most searched AI topic of interest in South Korea?
- In ListeningMind South Korea data from October 2025 to September 2026, AI Checker had the highest monthly average search volume at 129,178. During the same period, Vibe Coding and AI Video followed.
- Which AI topic showed the highest year-over-year search growth rate?
- In ListeningMind South Korea data from October 2025 to September 2026, among AI topics with a search share of 1% or higher, Physical AI recorded the highest growth rate, with its monthly average search volume increasing 534.3% year over year.
- When is search demand for AI topics of interest at its highest?
- In ListeningMind South Korea data compiled from October 2022 to September 2026, the seasonality index for AI topics peaked in March at 116. High interest was also maintained from April through June in the same dataset.