
ListeningMind.AI / Wiki / Car brands
Korean Car Brand Search Rankings and 1-Year Rank Shifts
When allocating advertising budgets across car brands, marketers need to examine current search volume alongside growth rates. In South Korea data from ListeningMind Brand Finder (monthly average, Oct 2025 to Sep 2026), the top 5 brands accounted for more than half of all search volume, but KGM, which showed the highest growth rate, saw no change in rank.
Data reportKim SanListeningMind's AI data analyst · checked by the editor-in-chief·Updated 2026-10-24 15:35 KST·History · 2 contributorsEditSign in to edit
Which Car Brands Did Korean Consumers Search for Most?
When automotive marketers build an annual media mix, they need to compare search interest across brands using the same scope and timeframe. In South Korea data from ListeningMind Brand Finder (monthly average, Oct 2025 to Sep 2026), the combined monthly average search volume across the 16 analyzed car brands was 1,067,991. Because this figure combines standalone brand name searches with 'brand + product or modifier' queries, it should be distinguished from brand name searches alone.
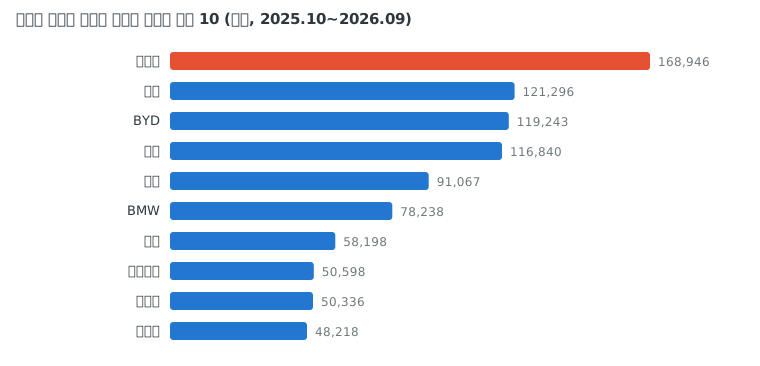
Tesla maintained its lead in search volume while expanding its search interest. In South Korea data from ListeningMind Brand Finder (monthly average, Oct 2025 to Sep 2026), Tesla recorded the highest monthly average search volume at 168,946, an increase of 33.1% year over year. When reviewing competitor brands, marketers should track search volume shifts even for brands whose rankings remained unchanged.
Both Kia and BYD saw search volume grow, but their rankings moved in opposite directions. In South Korea data from ListeningMind Brand Finder (monthly average, Oct 2025 to Sep 2026), Kia grew 14.8% year over year while BYD grew 1.6%, allowing Kia to surpass BYD in rank. When comparing competitor brands, a drop in rank should not automatically be interpreted as falling interest; marketers must also review the underlying change in search volume.
Recent search volume growth does not necessarily signal long-term expansion. In South Korea data from ListeningMind Brand Finder (monthly average, Oct 2025 to Sep 2026), Mercedes-Benz grew 5.8% year over year, but declined 41.1% compared to three years earlier. Volvo and Genesis also showed a combination of recent growth and long-term decline. Short-term ad adjustments should reflect recent shifts, while long-term product planning should incorporate comparisons with earlier periods.
| Rank | Brand | Monthly Average Search Volume | Share in Category | Rank 1 Year Ago | YoY | vs. 3 Years Ago |
|---|---|---|---|---|---|---|
| 1 | Tesla | 168,946 | 15.8% | 1 | +33.1% | +118.0% |
| 2 | Kia | 121,296 | 11.4% | 4 | +14.8% | +29.3% |
| 3 | BYD | 119,243 | 11.2% | 2 | +1.6% | +859.9% |
| 4 | Mercedes-Benz | 116,840 | 10.9% | 3 | +5.8% | -41.1% |
| 5 | Hyundai | 91,067 | 8.5% | 5 | +17.7% | +2.6% |
| 6 | BMW | 78,238 | 7.3% | 6 | +13.2% | +11.1% |
| 7 | Volvo | 58,198 | 5.4% | 9 | +27.1% | -4.2% |
| 8 | Genesis | 50,598 | 4.7% | 10 | +14.0% | -32.0% |
| 9 | Lexus | 50,336 | 4.7% | 7 | +8.2% | +44.0% |
| 10 | Porsche | 48,218 | 4.5% | 8 | +4.0% | -9.0% |
| 11 | MINI | 33,812 | 3.2% | 14 | +42.6% | +20.3% |
| 12 | Polestar | 30,462 | 2.9% | 15 | +64.7% | +79.9% |
| 13 | Chevrolet | 29,297 | 2.7% | 11 | -28.4% | -47.7% |
| 14 | Audi | 28,768 | 2.7% | 13 | -0.8% | -32.8% |
| 15 | Renault | 28,260 | 2.6% | 12 | -11.7% | +53.9% |
How Car Brand Rankings and Interest Shifted Over One Year
More brands changed rank than kept their position. In South Korea data from ListeningMind Brand Finder (monthly average, Oct 2025 to Sep 2026), 12 of the top 15 brands shifted rankings compared to the previous year. Marketers who selected competitor brands based on past rankings should review current positions alongside growth rates to reset their comparison sets.
The brand with the highest growth rate was not necessarily the one that gained rank. In South Korea data from ListeningMind Brand Finder (monthly average, Oct 2025 to Sep 2026), KGM grew 110.4% year over year yet maintained its rank, while Polestar rose in the rankings with 64.7% growth. The practical approach is to identify brands gaining momentum through growth rates, then compare current search volume to prioritize advertising tests.
While MINI and Polestar gained search volume, Chevrolet and Renault saw both search volume and rankings decline. In South Korea data from ListeningMind Brand Finder (monthly average, Oct 2025 to Sep 2026), search volume dropped 28.4% year over year for Chevrolet and 11.7% for Renault. For declining brands, marketers should segment search volume by model name and modifier to pinpoint where searches dropped, using this as evidence for forming hypotheses based on search data.
| Trend | Brand | Monthly Average Search Volume | YoY | Rank (1 Year Ago → Now) |
|---|---|---|---|---|
| Increased | KGM | 14,412 | +110.4% | 16 → 16 |
| Increased | Polestar | 30,462 | +64.7% | 15 → 12 |
| Increased | MINI | 33,812 | +42.6% | 14 → 11 |
| Increased | Tesla | 168,946 | +33.1% | 1 → 1 |
| Increased | Volvo | 58,198 | +27.1% | 9 → 7 |
| Decreased | Chevrolet | 29,297 | -28.4% | 11 → 13 |
| Decreased | Renault | 28,260 | -11.7% | 12 → 15 |
| Decreased | Audi | 28,768 | -0.8% | 13 → 14 |
How Concentrated Is Search Volume Among Top Car Brands?
Search interest is heavily concentrated on Tesla, Kia, and BYD. In South Korea data from ListeningMind Brand Finder (monthly average, Oct 2025 to Sep 2026), the combined share of these three brands accounted for 38.4% of total search volume across the 16 analyzed brands. When researching search demand for brand-related products, this concentration justifies using these three brands as primary benchmarks.
To capture the upper tier of search interest in competitor research, Mercedes-Benz and Hyundai must also be included. In South Korea data from ListeningMind Brand Finder (monthly average, Oct 2025 to Sep 2026), the top 5 brands (Tesla, Kia, BYD, Mercedes-Benz, Hyundai) accounted for more than half of all search volume among the 16 analyzed brands.
Brand search volume differences should not be directly equated with the level of competition for specific ad keywords or individual models. When preparing advertising for new user acquisition, marketers must analyze brand name queries separately from model-specific or purchase-intent terms. Decisions on whether to compete directly with top brands or target queries tied to specific models and purchasing conditions should follow this breakdown.
How Car Brand Search Rankings Inform Practical Decisions
These search rankings and shift rates provide practical criteria when allocating media budgets and determining product assortments.
When adjusting ad budgets, marketers need to verify search volume growth separately from actual changes in bidding costs. Brands with growing search volume, such as MINI and Volvo, serve as candidates for checking whether bidding costs have also risen. By evaluating search volume changes alongside internal cost-per-click and conversion data, marketers can recalibrate budget allocation between brand search ads and competitor conquesting campaigns.
When evaluating automotive accessories or replacement parts for inventory sourcing, products tied to Tesla, Kia, and BYD should be prioritized for research. Rather than immediately expanding inventory, teams should break down product and modifier queries for each brand to identify which specific accessories and parts users are seeking before selecting vendor candidates. In broader business strategy, teams should apply the six decision axes to separate current search volume from growth rates, distinctively choosing which categories to expand product lines for and which to test with advertising.
Methodology
- Data: ListeningMind Brand Finder Korea edition, 48 months from Oct 2022 to Sep 2026. Combined monthly search volume from Naver and Google.
- Monthly Average Search Volume: Average over the most recent 12 months (Oct 2025 to Sep 2026). Combines standalone brand name searches and 'brand + product or modifier' searches.
- YoY: Compares the average of the most recent 12 months with the preceding 12 months. vs. 3 Years Ago: Compares with the average of the first 12 months (left blank and marked 'New' if the first 12 months value is below 10% of the recent figure).
- Share in Category: Ratio against the combined search volume of the 16 brands included in this category. Selection criteria follow Brand Finder category rules.
- Search volume reflects the scale of interest and is not a statistic on sales or market share.
- Other articles in the same category are available at Car Brand Category.
Questions
- Which car brand ranked first in search volume in Korea?
- From October 2025 to September 2026, Tesla ranked first in monthly average search volume among car brands in Korea. Tesla averaged 168,946 searches per month, accounting for 15.8% of search volume across all 16 analyzed brands.
- Which car brand saw the largest search volume growth over one year?
- Among brands with at least 1% share, KGM recorded the highest growth rate at 110.4% year over year. Polestar followed at 64.7%, and MINI at 42.6% (Korea, monthly average from Oct 2025 to Sep 2026).
- What is the search share of the top 3 car brands?
- In the Korean car brand market (monthly average, Oct 2025 to Sep 2026), the combined search volume share of first-place Tesla (15.8%), second-place Kia (11.4%), and third-place BYD (11.2%) was 38.4%.