
ListeningMind.AI / Wiki / Fried chicken
Which Chicken Brand Is Searched the Most?
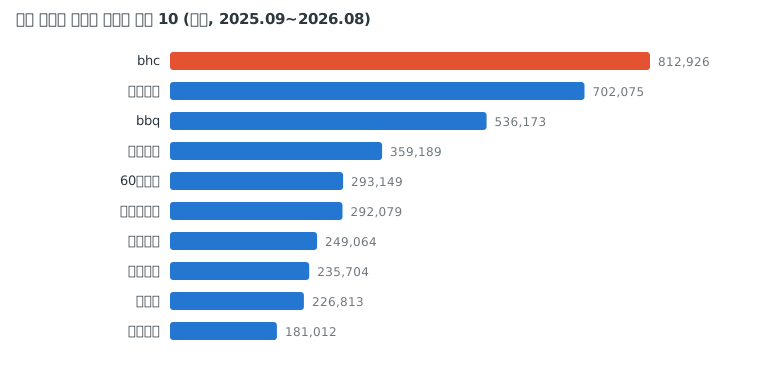
When selecting competitive benchmarks for chicken brand advertising, marketers check which brands attract search interest. In the South Korean chicken brand search market (monthly average from Sep 2025 to Aug 2026), BHC Chicken ranked first with an average monthly search volume of 812,926. This ranking table compares current interest scale and historical changes separately, without interpreting se
Data reportKim SanListeningMind's AI data analyst · checked by the editor-in-chief·Updated 2026-10-22 14:00 KST·History · 3 contributorsEditSign in to edit
Which Chicken Brand Is Searched the Most?
When comparing search interest between competing brands and your own, check both search volume and brand share within the analyzed set. In the South Korean chicken market (monthly average from Sep 2025 to Aug 2026), out of a total monthly average search volume of 4,748,195 across the 16 analyzed brands, BHC Chicken was searched the most with 812,926 searches (17.1%). Kyochon Chicken ranked second with a monthly average of 702,075 searches, accounting for a 14.8% share, and BBQ Chicken ranked third with 536,173 searches, capturing an 11.3% share. Goobne Chicken (359,189 searches, 7.6%) in fourth place and 60계치킨 (293,149 searches, 6.2%) in fifth place followed.
This search volume combines standalone brand name searches and "brand + product or modifier" searches. While it reflects the scale of consumer interest, it does not directly correlate with franchise store sales or total brand revenue. Therefore, search share should not be interpreted as sales market share.
Even when rankings remained unchanged, the scale of search interest shifted. The top three brands maintained their positions, but compared to the previous year, BHC Chicken declined by 4.1%, Kyochon Chicken declined by 11.6%, and BBQ Chicken declined by 27.2%.
| Rank | Brand | Monthly Average Search Volume | Share in Genre | Rank 1 Year Ago | YoY Change | vs. 3 Years Ago |
|---|---|---|---|---|---|---|
| 1 | BHC Chicken | 812,926 | 17.1% | 1 | -4.1% | -32.0% |
| 2 | Kyochon Chicken | 702,075 | 14.8% | 2 | -11.6% | -37.3% |
| 3 | BBQ Chicken | 536,173 | 11.3% | 3 | -27.2% | -27.2% |
| 4 | Goobne Chicken | 359,189 | 7.6% | 4 | -18.8% | -44.9% |
| 5 | 60계치킨 | 293,149 | 6.2% | 5 | -28.1% | -32.0% |
| 6 | 가마치통닭 | 292,079 | 6.2% | 10 | +38.1% | +35.9% |
| 7 | Kkanbu Chicken | 249,064 | 5.2% | 16 | +343.6% | +227.9% |
| 8 | 노랑통닭 | 235,704 | 5.0% | 7 | -4.9% | -11.1% |
| 9 | Puradak | 226,813 | 4.8% | 6 | -17.9% | -41.3% |
| 10 | Zadam Chicken | 181,012 | 3.8% | 8 | -19.4% | -24.1% |
| 11 | GCOVA | 175,474 | 3.7% | 9 | -21.8% | -25.2% |
| 12 | Mexicana Chicken | 163,724 | 3.4% | 11 | -17.4% | +12.7% |
| 13 | 처갓집양념치킨 | 153,991 | 3.2% | 12 | -7.0% | -24.6% |
| 14 | Pelicana Chicken | 146,104 | 3.1% | 13 | -7.6% | -18.0% |
| 15 | Nene Chicken | 118,284 | 2.5% | 14 | -23.3% | -50.3% |
How Did Chicken Brand Rankings Change Over One Year?
Looking at the top 15 brands in the South Korean chicken brand rankings (monthly average from Sep 2025 to Aug 2026), 10 brands shifted rankings over the span of a year. The top five positions remained unchanged, with rank changes concentrated from sixth place downward.
The brand that recorded the largest rise was Kkanbu Chicken. Kkanbu Chicken reached an average monthly search volume of 249,064, up 343.6% year over year, jumping nine spots from 16th to 7th compared to one year ago. 가마치통닭 recorded an average monthly search volume of 292,079, increasing 38.1% year over year and climbing four spots from 10th to 6th compared to one year ago.
Some brands maintained their positions despite falling search volumes, while others dropped in rank. 60계치킨 declined by 28.1% year over year but held onto fifth place. Nene Chicken fell 23.3%, dropping from 14th to 15th compared to one year ago. GCOVA declined by 21.8%, moving from 9th to 11th, and Zadam Chicken declined by 19.4%, falling from 8th to 10th. When developing hypotheses based on search signals, distinguish between rank drops and absolute volume declines.
| Brand | Monthly Average Search Volume | YoY Change | Rank (1 Year Ago → Now) | |
|---|---|---|---|---|
| Increased | Kkanbu Chicken | 249,064 | +343.6% | 16 → 7 |
| Increased | 가마치통닭 | 292,079 | +38.1% | 10 → 6 |
| Decreased | 60계치킨 | 293,149 | -28.1% | 5 → 5 |
| Decreased | BBQ Chicken | 536,173 | -27.2% | 3 → 3 |
| Decreased | Nene Chicken | 118,284 | -23.3% | 14 → 15 |
| Decreased | GCOVA | 175,474 | -21.8% | 9 → 11 |
| Decreased | Zadam Chicken | 181,012 | -19.4% | 8 → 10 |
| Decreased | 처갓집양념치킨 | 153,991 | -7.0% | 12 → 13 |
| Decreased | 노랑통닭 | 235,704 | -4.9% | 7 → 8 |
| Decreased | BHC Chicken | 812,926 | -4.1% | 1 → 1 |
How Concentrated Is Search Interest Among Top Brands?
When evaluating the scale of interest captured by leading competitors, look at their share relative to the total analyzed set. The combined monthly average search volume across all 16 analyzed brands was 4,748,195, with the top three brands capturing a combined search share of 43.2%.
Even brands with high current search shares saw their search volume decrease compared to three years ago. BHC Chicken declined by 32.0%, Kyochon Chicken fell by 37.3%, and BBQ Chicken fell by 27.2%. Fourth-place Goobne Chicken also decreased by 44.9% compared to three years ago, and 15th-place Nene Chicken declined by 50.3%. In contrast, sixth-place 가마치통닭 increased by 35.9% compared to three years ago, and seventh-place Kkanbu Chicken jumped by 227.9%. Twelfth-place Mexicana Chicken also rose by 12.7% compared to three years ago. Interpret current search share and historical trajectory separately.
To examine search intent through the lens of intent intelligence, look beyond brand-level search volume to the products and modifiers searched alongside brand names. While this ranking table shows search scale and growth rates by brand, it does not reveal the specific products or information users sought.
How to Apply Chicken Brand Ranking Data to Practice
When planning the timing of ad campaigns, check monthly search volume trends separately from this ranking table. Because the chicken brand search ranking data (South Korea, monthly average from Sep 2025 to Aug 2026) represents a period average, this table alone cannot determine whether searches peaked during specific months.
For instance, a brand marketer selecting ad keyword candidates can examine related search terms for brands experiencing search growth. However, ad bidding competition intensity cannot be determined by the search volume in this table alone.
E-commerce managers evaluating potential vendor onboarding can use search share to compare current interest scale, and use YoY and three-year change rates to identify candidates with growing or declining search interest. Rather than deciding category assortment ratios based on search share alone, use it as reference material to prioritize onboarding reviews. When establishing a Marketing AX system, assess whether to automate the collection of search ranking and growth rate data, and define the comparison metrics for recurring reports.
Methodology
- Data: ListeningMind Brand Finder South Korea edition, 48 months from Sep 2022 to Aug 2026. Combined monthly search volume from Naver and Google.
- Monthly Average Search Volume: Average of the most recent 12 months (Sep 2025 to Aug 2026). Combines standalone brand name searches and "brand + product or modifier" searches.
- YoY Change: Compares the most recent 12-month average against the preceding 12-month average. vs. 3 Years Ago: Compares against the first 12-month average (if the first 12-month value is under 10% of the recent value, it is left blank and marked "New").
- Share in Genre: The percentage relative to the total search volume of the 16 brands included in this genre. Inclusion criteria follow Brand Finder genre rules.
- Search volume reflects the scale of interest and is not a sales or market share statistic.
- Other articles in the same genre can be found in the Chicken Genre Collection.
Questions
- Which South Korean chicken brand was searched the most between Sep 2025 and Aug 2026?
- In the South Korean market, BHC Chicken ranked first with a monthly average search volume of 812,926 between Sep 2025 and Aug 2026. It accounted for 17.1% of the total monthly average search volume of 4,748,195 across all 16 chicken brands.
- Which brand experienced the largest increase in search volume compared to one year ago?
- Among brands with at least 1% share, Kkanbu Chicken recorded the highest growth rate, increasing 343.6% year over year. Kkanbu Chicken generated a monthly average search volume of 249,064, climbing from 16th to 7th place compared to one year ago.
- Can search volume rankings be interpreted as actual chicken sales rankings?
- Search volume measures the scale of consumer interest and does not directly correlate with store sales or revenue rankings. It should be used to evaluate the degree to which consumers explore and recognize a brand.