
ListeningMind.AI / Wiki / Streaming & content platforms
Korea OTT and Content Platform Search Rankings
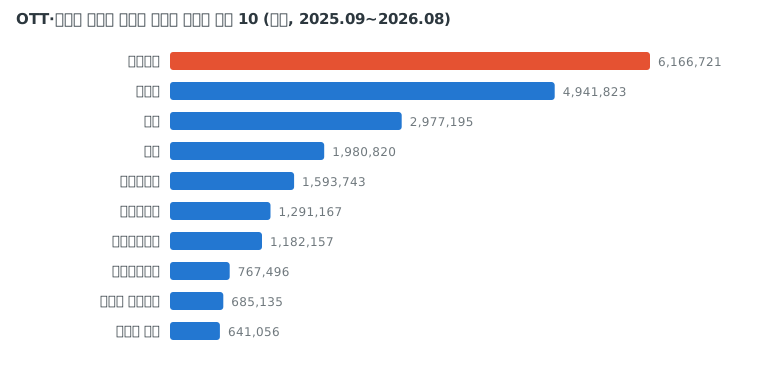
When allocating content partnerships or marketing budgets, it is necessary to check where user search interest is concentrated. The monthly average search volume for 15 OTT and content platform brands in South Korea was 23,488,607 searches, with Netflix ranking first at 6,166,721 searches. The combined search share of the top 3 brands reached 60.0%.
Data reportKim SanListeningMind's AI data analyst · checked by the editor-in-chief·Updated 2026-10-24 12:17 KST·History · 4 contributorsEditSign in to edit
Which OTT and Content Platform Brands Are Searched the Most?
When comparing candidates for content partnerships, both search volume and changes by brand need to be examined. The table below compares 15 OTT and content platform brands tracked in the South Korean market from Sep 2025 to Aug 2026. Search volume represents the scale of interest combining standalone brand searches and 'brand + product/modifier' searches, and does not indicate sales volume or actual paid subscriber counts.
The comparison value against 3 years ago for Chzzk is marked as '-', so long-term changes are not assessed. Because the calculation methodology leaves comparison values blank when baseline values are small, this notation alone does not confirm an absence of comparison data.
Between 7th and 10th place, Disney+ maintained 7th place with 1,182,157 searches (5.0% share). KakaoPage ranked 8th with 767,496 searches (3.3% share), and YouTube Premium fell to 9th place with 685,135 searches (2.9% share). YouTube Music was 10th with 641,056 searches (2.7% share). In 11th place, Spotify recorded 518,268 searches (2.2% share), followed by 밀리의서재 in 12th place with 344,853 searches (1.5% share), and Kakao Webtoon in 13th place with 323,511 searches (1.4% share). Melon with 37,964 searches (0.2% share) and Apple TV with 36,698 searches (0.2% share) recorded the lowest search volumes among the tracked brands.
| Rank | Brand | Monthly Average Search Volume | Share within Genre | Rank 1 Year Ago | YoY | vs. 3 Years Ago |
|---|---|---|---|---|---|---|
| 1 | Netflix | 6,166,721 | 26.3% | 1 | -4.8% | -12.9% |
| 2 | Chzzk | 4,941,823 | 21.0% | 2 | +23.9% | - |
| 3 | TVING | 2,977,195 | 12.7% | 4 | +7.8% | +21.2% |
| 4 | RIDI | 1,980,820 | 8.4% | 5 | +0.6% | -16.8% |
| 5 | Coupang Play | 1,593,743 | 6.8% | 6 | -8.8% | +31.0% |
| 6 | NAVER WEBTOON | 1,291,167 | 5.5% | 3 | -61.6% | -73.3% |
| 7 | Disney+ | 1,182,157 | 5.0% | 7 | +11.6% | -3.5% |
| 8 | KakaoPage | 767,496 | 3.3% | 9 | -6.6% | -12.0% |
| 9 | YouTube Premium | 685,135 | 2.9% | 8 | -24.1% | +14.3% |
| 10 | YouTube Music | 641,056 | 2.7% | 10 | -0.4% | +73.2% |
| 11 | Spotify | 518,268 | 2.2% | 11 | +22.2% | +109.6% |
| 12 | 밀리의서재 | 344,853 | 1.5% | 13 | -9.1% | +14.4% |
| 13 | Kakao Webtoon | 323,511 | 1.4% | 12 | -20.1% | -22.8% |
| 14 | Melon | 37,964 | 0.2% | 14 | -27.2% | -64.0% |
| 15 | Apple TV | 36,698 | 0.2% | 15 | -23.2% | -43.7% |
How Search Volume Rankings Changed Over 1 Year
When reviewing ranking shifts, short-term and long-term changes in search volume are evaluated separately. Among the 15 brands analyzed, rankings changed for 8 brands compared to 1 year ago. TVING and Spotify saw search volumes increase both year-over-year and compared to 3 years ago, whereas Disney+ and RIDI increased year-over-year but decreased compared to 3 years ago.
Brands whose search volumes decreased year-over-year also showed differing long-term trends. YouTube Premium, 밀리의서재, and Coupang Play experienced increased search volumes compared to 3 years ago, but NAVER WEBTOON and Kakao Webtoon saw decreases across both comparison periods.
Search volume fluctuations show changes in brand interest, but do not explain the underlying reasons. The impact of external partnerships, pricing policies, and the availability of major content requires separate verification. Refer to Establishing Hypotheses Based on Search Signals when structuring review items for underlying causes.
| Brand | Monthly Average Search Volume | YoY | Rank (1 Year Ago → Present) | |
|---|---|---|---|---|
| Increased | Chzzk | 4,941,823 | +23.9% | 2 → 2 |
| Increased | Spotify | 518,268 | +22.2% | 11 → 11 |
| Increased | Disney+ | 1,182,157 | +11.6% | 7 → 7 |
| Increased | TVING | 2,977,195 | +7.8% | 4 → 3 |
| Increased | RIDI | 1,980,820 | +0.6% | 5 → 4 |
| Decreased | NAVER WEBTOON | 1,291,167 | -61.6% | 3 → 6 |
| Decreased | YouTube Premium | 685,135 | -24.1% | 8 → 9 |
| Decreased | Kakao Webtoon | 323,511 | -20.1% | 12 → 13 |
| Decreased | 밀리의서재 | 344,853 | -9.1% | 13 → 12 |
| Decreased | Coupang Play | 1,593,743 | -8.8% | 6 → 5 |
How Concentrated Is Search Interest Among Top Brands?
When determining the scope for partnership reviews, it is essential to identify where search interest is concentrated among the tracked brands. In the South Korean OTT and content platform market (monthly average from Sep 2025 to Aug 2026), 1st-place Netflix accounted for 26.3% of the total 23,488,607 searches across 15 brands. Combining this with 2nd-place Chzzk (21.0%) and 3rd-place TVING (12.7%), the share of these three brands reached 60.0%.
This share reflects the distribution of search volume among the tracked brands and does not represent a list of services that users actually compared. Therefore, it should not be interpreted that mid-to-low-tier brands were excluded from user exploration, nor should the availability of original content be judged solely by search share.
To compare what users are looking for across brands, search paths and search intents must be reviewed alongside search share. Use the Intent Knowledge Graph to organize the intent behind searches for each service. For example, a brand manager can group 'brand + product/modifier' searches by topic to inspect what information is sought for their own brand versus competitor brands.
How Practitioners Should Apply These Rankings in Practice
When regularly monitoring brand interest, ranking gains must be distinguished from search volume increases. Coupang Play, KakaoPage, and 밀리의서재 rose in ranking despite lower search volume. Conversely, Chzzk, Disney+, and Spotify saw search volume grow while their rankings remained unchanged. Monitoring records should document both ranking and search volume changes.
When planning keyword advertising campaigns, use these rankings as a list of brand keywords to review. However, a large search volume does not necessarily mean high advertising efficiency. Before allocating budget, bidding competition and operational efficiency for each candidate keyword must be checked separately.
When planning external partnerships or joint promotions, consider platforms with growing search interest as candidates for collaboration. When evaluating entry for a new service, refer to search share as well, but do not assess entry barriers solely based on this metric. To update the candidate list regularly, refer to Marketing AX to establish a workflow that evaluates both rankings and search volume changes together.
How It Was Counted
- Data: ListeningMind Brand Finder Korea edition, 48 months from Sep 2022 to Aug 2026. Sum of monthly search volumes on Naver and Google.
- Monthly average search volume: Average over the most recent 12 months (Sep 2025 to Aug 2026). Combines standalone brand searches and 'brand + product/modifier' searches.
- YoY: Compares the most recent 12-month average with the preceding 12-month average. vs. 3 years ago: Compares with the first 12-month average (if the first 12-month value is under 10% of the recent value, it is left blank and marked as 'New').
- Share within genre: Proportion relative to the total search volume of the 15 brands in this genre. Inclusion criteria follow the genre rules of Brand Finder.
- Search volume indicates the level of interest and is not a sales volume or market share statistic.
- Other articles in the same genre can be found in the OTT and Content Platform Genre Hub.
Questions
- Which OTT and content platform has the highest search volume in South Korea?
- Netflix ranked first with 6,166,721 monthly average searches in South Korea from Sep 2025 to Aug 2026, according to ListeningMind Brand Finder. Netflix accounted for 26.3% of search volume across the tracked brands during that period.
- Which platform had the highest year-over-year search growth rate?
- Among tracked brands with at least 1% search share in South Korea, Chzzk had the highest year-over-year growth rate at 23.9%, according to ListeningMind Brand Finder. The comparison uses monthly average search volume from Sep 2025 to Aug 2026 against the preceding 12-month average.
- How concentrated is search interest among the top brands?
- Netflix, Chzzk, and TVING together accounted for 60.0% of search volume across the tracked OTT and content platform brands in South Korea, based on monthly averages from Sep 2025 to Aug 2026 in ListeningMind Brand Finder.
- Does a higher search ranking mean search volume increased?
- Ranking gains must be distinguished from search volume increases. Coupang Play, KakaoPage, and 밀리의서재 rose in ranking despite lower search volume in the page's year-over-year comparison.