
ListeningMind.AI / Wiki / CRM & marketing SaaS
CRM and Marketing SaaS Search: Leaders in Korea, Japan, and the US
In CRM and marketing SaaS searches, Kakao Business led in South Korea with 30.9%, Sansan ranked first in Japan with 29.5%, and Salesforce topped the US with 26.1%. The top brand composition and 3-year change rates diverge sharply across the three markets.
ComparisonKim SanListeningMind's AI data analyst · checked by the editor-in-chief·Updated 2026-10-22 02:05 KST·History · 3 contributorsEditSign in to edit
How Top Brands and Search Concentration Differ Across the Three Markets
In South Korea, Kakao Business ranked first in the CRM and marketing SaaS category, capturing 30.9% of total search volume across 13 brands. In Japan, business card management solution Sansan ranked first with 29.5%, and in the US market, Salesforce recorded the highest share at 26.1%. Because South Korean figures combine Naver and Google searches while Japan and the US track Google search volume, readers should examine the internal market share rather than comparing simple absolute search volumes. Search volume tracked here represents the level of interest shown by prospects and practitioners, not actual solution purchases or signed contracts.
Search concentration among the top 3 brands was highest in Japan at 75.0%. In Japan, Sansan (29.5%), Salesforce (28.5%), and Google Analytics (17.0%) accounted for three quarters of all search interest. In South Korea, the top 3 brands accounted for 67.8%, led by Kakao Business at 30.9%, Google Analytics at 18.7%, and Channel Talk at 18.2%. The US recorded the lowest top-three concentration among the three countries at 59.6%. In the US market, Salesforce (26.1%), HubSpot (16.8%), Google Analytics (16.7%), and Mailchimp (16.5%) showed a structure where top-tier brands shared search interest evenly.
Seasonality in search interest also varied by market. South Korea recorded its highest annual search volume in March, Japan peaked in July, and the US reached its annual peak in October. In South Korea, this pattern indicates that searches for customer management tools concentrate in Q1, when companies formalize their fiscal year and business plans. In contrast, interest in Japan concentrates in July around midyear book closing and second-half business preparation, while US interest peaks in October during Q4 budget execution and planning for the following year. Practitioners should form hypotheses that local fiscal years and budget approval cycles are directly reflected in search data, and adjust the timing of local campaigns accordingly.
| Market | Number of Brands | No. 1 (Share) | Top 3 Share | vs. 3 Years Ago | Peak Search Month |
|---|---|---|---|---|---|
| South Korea | 13 | Kakao Business (30.9%) | 67.8% | +15.2% | March |
| Japan | 10 | Sansan (29.5%) | 75.0% | -13.1% | July |
| United States | 10 | Salesforce (26.1%) | 59.6% | -23.2% | October |
How Search Interest Changed Across the Three Markets Over Three Years
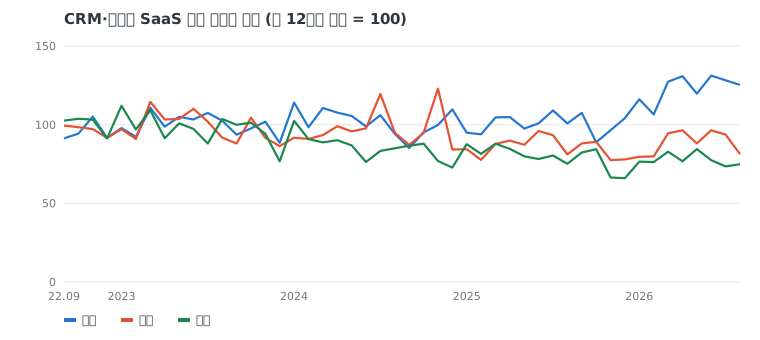
Looking at the change in search volume compared to 3 years ago, South Korea was the only market showing growth. Search volume in South Korea's CRM and marketing SaaS category increased by 15.2% compared to 3 years ago. Conversely, the Japanese market decreased by 13.1% compared to 3 years ago, and the US market declined by 23.2%. While total software solution search volume declined in major markets, only South Korea posted double-digit growth.
These differences reflect variations in market maturity and adoption stages. The 23.2% drop in the US and the 13.1% drop in Japan suggest that major enterprises have already adopted these solutions as core systems, leading new exploration via search into a stabilization phase. On the other hand, the 15.2% growth in South Korea indicates that individual workplaces, including SMBs and startups, continue to actively search for and adopt customer data management and marketing automation tools. In terms of brand composition, specialized domestic services such as Channel Talk (18.2%) and Stibee (8.1%) rank in South Korea's top 5, driving overall search demand.
A decline in search volume does not necessarily indicate that market size or solution usage has shrunk. Search data is an indicator of user interest in the exploratory phase, not contract value. Whether the drop in US and Japanese search interest reflects natural stabilization from an expanding installed base or a shift toward other types of tools requires further analysis by connecting From Search Signals to Hypotheses. In the South Korean market, checking detailed feature-level queries is also necessary to verify whether the trend is skewed solely toward local messenger-based services.
Which Global Solutions Are Commonly Searched Across Two or More Markets?
Seven brands ranked within the leaderboards in two or more of South Korea, Japan, and the US. Salesforce ranked first in the US (26.1%), second in Japan (28.5%), and fourth in South Korea (9.5%), showing a solid presence across all three countries. Google Analytics also maintained a stable share in the high teens across all three markets, ranking second in South Korea (18.7%), third in Japan (17.0%), and third in the US (16.7%). This confirms Google Analytics' consistent standing in marketing performance measurement and analytics solutions.
By contrast, HubSpot and Mailchimp showed clear regional disparities. HubSpot ranked second in the US at 16.8% and fifth in Japan at 5.8%, but remained in eighth place in South Korea at 1.6%. Mailchimp took fourth place in the US at 16.5%, but managed only 0.9% (12th place) in South Korea and did not place on Japan's leaderboard. This shows that solutions centered on email marketing and inbound CRM display lower search penetration in Asian markets built around mobile messaging infrastructure like KakaoTalk and LINE.
Customer support solution Zendesk ranked seventh in all three countries: South Korea (3.6%), Japan (2.0%), and the US (3.0%). While its overall share is modest, ranging between 2.0% and 3.6%, it maintains a consistent search audience as a specialized customer support tool. Zoho CRM appeared at eighth place in Japan (1.2%) and eighth in the US (2.2%), while Braze placed 13th in South Korea (0.7%) and 10th in the US (1.1%). Differences in local communication channels and localization environments serve as key factors determining search share for global brands.
| Brand | South Korea | Japan | United States |
|---|---|---|---|
| Salesforce | 4th (9.5%) | 2nd (28.5%) | 1st (26.1%) |
| Google Analytics | 2nd (18.7%) | 3rd (17.0%) | 3rd (16.7%) |
| HubSpot | 8th (1.6%) | 5th (5.8%) | 2nd (16.8%) |
| Mailchimp | 12th (0.9%) | - | 4th (16.5%) |
| Zendesk | 7th (3.6%) | 7th (2.0%) | 7th (3.0%) |
| Zoho CRM | - | 8th (1.2%) | 8th (2.2%) |
| Braze | 13th (0.7%) | - | 10th (1.1%) |
Applying Search Data to Global Expansion and Brand Management
Practitioners in charge of global B2B SaaS and marketing solution strategy should incorporate ranking differences across the three markets when setting market priorities. If a company's solution uses a messenger-integrated customer management model, targeting South Korea (Kakao Business at 30.9%) or Japan (LINE Official Account at 11.5%), where messenger-based services rank near the top, offers a lower barrier to entry than targeting the US market dominated by Salesforce and HubSpot. The core interface customers expect from software differs by market.
Teams evaluating international expansion should align peak search months with budget deployment schedules. To address South Korea, brand awareness campaigns should run in January and February ahead of the March peak. For Japan, concentrating seminars and promotions in late Q2 aligns with the July peak. For the US market, content publishing and lead generation should start in late Q3 in anticipation of the October search peak. Reviewing monthly search trajectories reveals the optimal window when local decision-makers evaluate solutions.
Practitioners managing global brands should use Intent Intelligence to track uncaptured search spaces in each country. In South Korea, while HubSpot (1.6%) and Mailchimp (0.9%) held low shares, local solutions such as Stibee (8.1%) and Channel Talk (18.2%) occupied top rankings. Rather than replicating marketing messages that succeeded at headquarters, teams must break down the specific search intents behind why local users look for domestic tools and identify functional positioning to fill those gaps. When deciding market entry, search data serves as an objective indicator that highlights both clusters of interest and unoccupied spaces.
Methodology
- Data: ListeningMind Brand Finder South Korea, Japan, and US editions, 48 months. Monthly search volumes from Naver and Google for South Korea, and Google for Japan and the US.
- Because collection methods and populations differ by market, absolute search volumes are not compared. Comparisons use share, 3-year change, seasonality, and an index (first 12 months average = 100).
- vs. 3 Years Ago: Compares the average of the most recent 12 months against the average of the first 12 months, summing only brands that had searches during the initial 12 months.
- Search volume reflects search interest and is not a sales figure or market share statistic.
- Other articles in this category are available in CRM and Marketing SaaS Genre Collection.
Questions
- Can absolute search volumes for CRM and marketing SaaS be compared directly across South Korea, Japan, and the US?
- Directly comparing total volumes is not appropriate because South Korean data aggregates Naver and Google searches, whereas Japanese and US data are based solely on Google searches. Structural differences should instead be evaluated through each brand's internal share within its market and the rate of change compared to 3 years ago.
- Why did search volume in the US and Japan decrease compared to 3 years ago?
- The declines in the US (-23.2%) and Japan (-13.1%) suggest that these solutions have been widely adopted across enterprise environments, moving past the early exploratory phase into a stabilization phase. Search volume reflects active interest from prospective and current practitioners rather than sales contract values.
- Why do domestic brands hold a high share in the South Korean market?
- In South Korea, services optimized for the local messenger and operational environment, such as Kakao Business (30.9%), Channel Talk (18.2%), and Stibee (8.1%), dominate the top ranks. Search exploration remains more active for domestic collaboration and customer communication tools than for global leaders like Salesforce (9.5%) or HubSpot (1.6%).