
ListeningMind.AI / Wiki / Cloud & dev infrastructure
Cloud and Developer Infrastructure Search: Korea, Japan, and the US
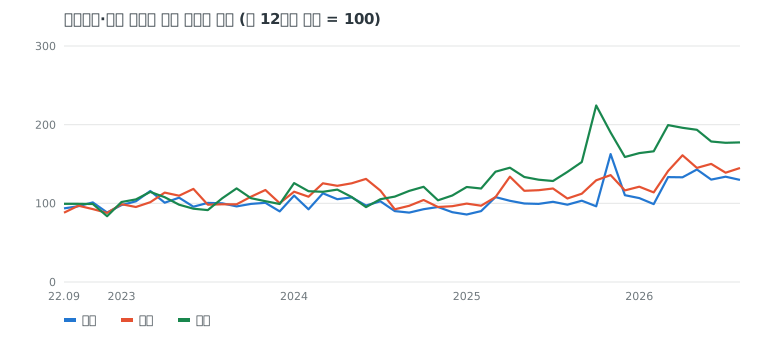
Teams planning market entry or developer outreach need to understand which infrastructure brands practitioners search for in each region. Compared to three years ago, search volume grew +81.5% in the US, +34.2% in Japan, and +23.5% in Korea.
ComparisonKim SanListeningMind's AI data analyst · checked by the editor-in-chief·Updated 2026-10-22 08:41 KST·History · 3 contributorsEditSign in to edit
Top Brands and Share Concentration across the Three Markets
Developers and infrastructure engineers in all three countries typed the same name first into the search bar. Combining Naver and Google data for South Korea, and examining Google search volume in Japan and the United States, GitHub ranked first with shares of 36.6%, 33.8%, and 37.7% respectively. Search volume represents user interest rather than sales volume. The data shows that across all three countries, developers search for GitHub most actively as the central gateway to the development ecosystem.
Looking at the search concentration of the top three brands, the US is highest at 62.7%, followed by Korea at 62.1% and Japan at 58.1%. In the US, the top tier consists of GitHub (37.7%), AWS (12.8%), and Cloudflare (12.2%). In Korea, GitHub (36.6%), AWS (13.9%), and Google Cloud (11.6%) also account for more than half. In contrast, Japan has a relatively more distributed share among its top tier: GitHub (33.8%) and AWS (14.5%) are followed closely by Google Cloud (9.8%) and Sakura Internet (9.2%).
The timing of peak interest also differs by market. Korea saw the highest search volume in November, while the US reached its annual peak in October. Japan experienced its highest concentration of searches in April, when corporate fiscal years and school terms begin. You can connect this to from search signals to hypotheses by considering that infrastructure adoption and learning cycles align with market-specific schedules.
| Market | Brand Count | No. 1 (Share) | Top 3 Share | vs. 3 Years Ago | Peak Search Month |
|---|---|---|---|---|---|
| Korea | 12 | GitHub (36.6%) | 62.1% | +23.5% | November |
| Japan | 10 | GitHub (33.8%) | 58.1% | +34.2% | April |
| United States | 10 | GitHub (37.7%) | 62.7% | +81.5% | October |
Where Infrastructure Search Interest Grew Most over Three Years
Search volume in the US market increased by +81.5% compared to three years ago, marking the steepest growth among the three countries. This reflects a substantial increase in search demand across major infrastructure services in the US, including Cloudflare (12.2%) and Azure (8.5%). Over the same period, search volume grew +34.2% in Japan and +23.5% in Korea.
Alongside growth trajectories, the position of domestic infrastructure providers is noteworthy. In Korea, Gabia ranks fourth with an 11.3% share. In Japan, Sakura Internet and Xserver share fourth and fifth place, each with a 9.2% search share. By contrast, the top five in the US are entirely global services: GitHub, AWS, Cloudflare, Google Cloud, and Azure.
While practitioners in Korea and Japan actively look for global cloud services, they continue to evaluate domestic brands during domain, hosting, and local server setup phases. When new solutions enter a market, this data prompts teams to consider how to target local hosting and infrastructure users from a non-customer perspective.
Global Brands with Consistent Reach across Multiple Markets
Five brands placed near the top in two or more markets: GitHub, AWS, Google Cloud, Cloudflare, and Azure. These five services have become standard infrastructure choices for practitioners in all three countries.
AWS maintained second place in every market, holding second in Korea (13.9%), second in Japan (14.5%), and second in the US (12.8%). Among major CSPs, Google Cloud forms a stable tier in third to fourth place, ranking third in Korea (11.6%), third in Japan (9.8%), and fourth in the US (10.8%).
Cloudflare and Azure show clearer rank shifts across regions. Cloudflare took third in the US at 12.2%, fifth in Korea at 11.2%, and sixth in Japan at 8.5%. Cloudflare's share is highest in the US, followed by Korea and Japan. Azure placed fifth in the US at 8.5%, but held only eighth in Japan (4.7%) and seventh in Korea (2.5%). This highlights a gap between brand awareness tracked at global headquarters and the actual search demand entered by local practitioners.
| Brand | Korea | Japan | United States |
|---|---|---|---|
| GitHub | 1st 36.6% | 1st 33.8% | 1st 37.7% |
| AWS | 2nd 13.9% | 2nd 14.5% | 2nd 12.8% |
| Google Cloud | 3rd 11.6% | 3rd 9.8% | 4th 10.8% |
| Cloudflare | 5th 11.2% | 6th 8.5% | 3rd 12.2% |
| Azure | 7th 2.5% | 8th 4.7% | 5th 8.5% |
Using This Data for Global Expansion and Brand Management
Market-level search share data serves as a baseline when prioritizing new market entry. SaaS and IT solution planners exploring expansion into a specific country must examine the infrastructure foundation local developers use to build their tech stacks. For teams entering Japan, it makes sense to prioritize integration not only with the global Big Three, but also with local infrastructure providers that command a 9.2% search share.
Global brand marketers can allocate budgets and messaging differently based on the competitive landscape of each country. In the US, Cloudflare holds a 12.2% search share, close to AWS (12.8%), whereas in Korea and Japan it competes with local providers and Google Cloud. Positioning messages should be adjusted to match each country's search share dynamics, even for the same brand campaign.
Research and corporate strategy teams use this search data to measure actual shifts in practitioner interest. By tracking quarterly changes in search share using Intent Intelligence, organizations can identify changes in the competitive landscape quickly without relying solely on qualitative interviews or one-off surveys.
Methodology
- Data: ListeningMind Brand Finder Korea, Japan, and US editions, covering 48 months. Korean figures reflect Naver and Google combined monthly search volumes, while Japan and the US reflect Google monthly search volumes.
- Because data collection methods and population sizes differ across markets, raw search volumes are not directly compared. Comparisons are made using share, 3-year change, seasonality, and an index (first 12-month average = 100).
- Change vs. 3 years ago: Compares the average of the first 12 months with the average of the most recent 12 months, aggregating only brands with recorded searches in the first 12 months.
- Search volume reflects level of interest, not sales volume or official market share statistics.
- Related articles in the same category can be found in the Cloud and Developer Infrastructure Collection.
Questions
- Which market saw the largest increase in infrastructure-related search volume over the past 3 years?
- The US market grew the most, rising +81.5% compared to three years ago. Over the same period, search volume increased by +34.2% in Japan and +23.5% in Korea.
- What common characteristic appears in both the Korean and Japanese markets?
- Domestic infrastructure providers rank among the top five alongside major global CSPs. In Korea, Gabia placed fourth with an 11.3% share, while in Japan, Sakura Internet and Xserver ranked fourth and fifth respectively, each with a 9.2% share.
- Which month has the highest annual search volume in each market?
- In Korea, searches peaked annually in November. In Japan, searches concentrated in April, and in the US, in October. Search volume reflects the level of user interest rather than sales volume.
- Which brands ranked first and second across all three markets?
- Based on the 3-year analysis, GitHub and AWS ranked first and second across Korea, Japan, and the US. First-place GitHub held shares of 36.6% in Korea, 33.8% in Japan, and 37.7% in the US. Second-place AWS recorded shares of 13.9% in Korea, 14.5% in Japan, and 12.8% in the US.
- What criteria were used to collect and compare search volume data across Korea, Japan, and the US?
- For collection channels over the recent 3-year period, Korea combined Naver and Google, while Japan and the US tracked Google search volume only. Because the sources differ, total search volumes are not directly compared; instead, relative shares and rates of change within each market are evaluated. Because search volume indicates interest rather than sales volume, it serves as reference material for assessing overseas expansion and global brand management.