
ListeningMind.AI / Wiki / Collaboration tools
Notion Is the Most Searched Collaboration Tool Brand in Korea
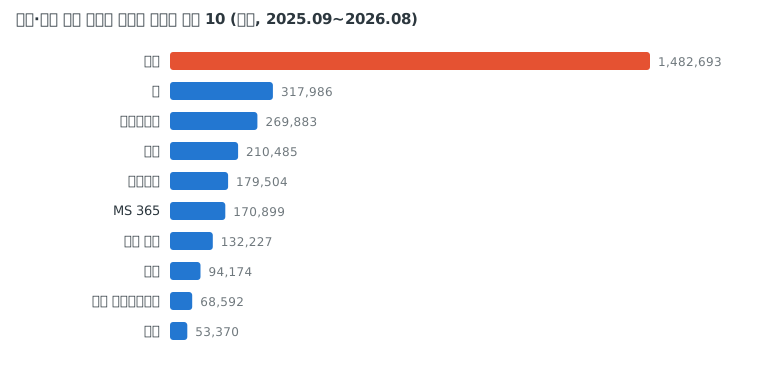
When adopting internal collaboration tools or selecting workplace software partners, understanding where user interest is focused is essential. Among 12 collaboration and productivity tool brands in Korea, Notion ranked first with a monthly average search volume of 1,482,693 searches, accounting for 49.0% of the total, while the top 3 brands together reached a combined share of 68.4%.
Data reportKim SanListeningMind's AI data analyst · checked by the editor-in-chief·Updated 2026-10-22 11:23 KST·History · 3 contributorsEditSign in to edit
Which Collaboration and Workplace Tool Brand Is Searched Most Often
When assessing competitors or partnership candidates, checking which brands follow Notion in search volume is also necessary. In the Korean collaboration and workplace tools genre, Zoom ranked second (317,986 searches, 10.5%), and Naver Works ranked third (269,883 searches, 8.9%) (Korea, monthly average from Sep 2025 to Aug 2026).
Current search volume rankings and long-term changes should be reviewed separately. While first-place Notion saw its search volume increase by +84.6% compared to 3 years ago, second-place Zoom decreased by -35.5%. This reflects changes in search volume for these two individual brands, not the broader interest trends across all video conferencing tools or all-in-one workspace tools.
Search volume indicates the scale of public interest, not actual software spending or paid subscriber numbers. Ranking data alone cannot show how much of the volume comes from personal account usage or free template searches. When moving from search signals to hypotheses, it is necessary to distinguish searches with purchase intent from searches seeking help during daily use.
| Rank | Brand | Monthly Average Search Volume | Share in Genre | Rank 1 Year Ago | YoY | vs. 3 Years Ago |
|---|---|---|---|---|---|---|
| 1 | Notion | 1,482,693 | 49.0% | 1 | +14.0% | +84.6% |
| 2 | Zoom | 317,986 | 10.5% | 2 | -0.2% | -35.5% |
| 3 | Naver Works | 269,883 | 8.9% | 3 | +9.3% | +44.5% |
| 4 | Slack | 210,485 | 7.0% | 5 | +18.2% | +33.1% |
| 5 | Hiworks | 179,504 | 5.9% | 6 | +18.8% | +53.8% |
| 6 | MS 365 | 170,899 | 5.7% | 4 | -12.6% | -6.5% |
| 7 | Google Meet | 132,227 | 4.4% | 7 | -1.4% | -22.6% |
| 8 | Teams | 94,174 | 3.1% | 8 | -3.5% | +8.1% |
| 9 | Google Workspace | 68,592 | 2.3% | 10 | +84.4% | +216.4% |
| 10 | Jira | 53,370 | 1.8% | 9 | -14.9% | -11.7% |
| 11 | Confluence | 24,127 | 0.8% | 11 | +0.2% | +0.4% |
| 12 | Trello | 20,773 | 0.7% | 12 | -5.0% | -27.6% |
How Brand Rankings Changed Over the Past Year
Among the 12 brands surveyed, 5 shifted rankings over the past year. Google Workspace recorded the highest YoY growth rate, rising +84.4%. Compared to 3 years ago, it increased by +216.4%. Rank shifts by brand can be checked alongside search volume changes in the table below.
Some brands rose in rank alongside higher search volumes. Hiworks grew +18.8% YoY, moving up from sixth to fifth place (179,504 searches), while Slack rose +18.2%, moving from fifth to fourth place (210,485 searches). Notion (+14.0%) and Naver Works (+9.3%) also recorded higher search volumes than a year ago.
For brands with declining search volume, both the margin of decrease and the change in rank need review. Jira fell -14.9% YoY, sliding from ninth to tenth place (53,370 searches). MS 365 dropped -12.6%, moving from fourth to sixth place (170,899 searches). Teams declined -3.5%, Google Meet fell -1.4%, and Zoom decreased -0.2%.
| Change | Brand | Monthly Average Search Volume | YoY | Rank (1 Year Ago → Now) |
|---|---|---|---|---|
| Increased | Google Workspace | 68,592 | +84.4% | 10 → 9 |
| Increased | Hiworks | 179,504 | +18.8% | 6 → 5 |
| Increased | Slack | 210,485 | +18.2% | 5 → 4 |
| Increased | Notion | 1,482,693 | +14.0% | 1 → 1 |
| Increased | Naver Works | 269,883 | +9.3% | 3 → 3 |
| Decreased | Jira | 53,370 | -14.9% | 9 → 10 |
| Decreased | MS 365 | 170,899 | -12.6% | 4 → 6 |
| Decreased | Teams | 94,174 | -3.5% | 8 → 8 |
| Decreased | Google Meet | 132,227 | -1.4% | 7 → 7 |
| Decreased | Zoom | 317,986 | -0.2% | 2 → 2 |
How Concentrated Is Search Volume Among Top Brands
When using search share for competitive benchmarking, first confirm the scope of aggregation. The baseline for the share calculated here is 3,024,713 searches, which is the total monthly average search volume of the 12 brands surveyed. It does not represent total sales revenue or user market share across the entire Korean collaboration software market.
Brands ranking fourth or lower each hold a search share of 7% or less. Slack in fourth place accounts for 7.0%, Hiworks in fifth place holds 5.9%, and MS 365 in sixth place has 5.7%. Confluence in 11th place (0.8%) and Trello in 12th place (0.7%) remained below 1%.
Search share alone cannot determine which tool a user encountered first or whether a user treats another tool as a secondary option. When evaluating tool integrations or partnerships, co-searched brands and actual usage combinations should be examined separately.
How to Use Ranking Data in Business Operations
When applying this data, first determine whether it will be used for comparing search share, evaluating advertising keywords, or researching internal adoption candidates.
For example, brand marketers can check whether their Share of Search increased when brand search volume went up. This approach compares changes in brand search volume against changes across the entire genre. When reviewing traffic acquisition channels and messaging, examine products and modifiers paired with the brand name from an Intent Intelligence perspective.
When reorganizing advertising keyword groups, brands with growing search volumes should be evaluated. Google Workspace (+84.4%) and Slack (+18.2%) posted YoY gains, but these numbers alone should not be used to gauge purchase intent or bidding competition intensity. Verify whether keywords related to substitute exploration exist before updating keyword groups.
When IT or AX managers shortlist candidates for internal collaboration tools, search rankings serve as reference material for market interest. User experience across employees and external partners as well as training costs cannot be verified from this data and must be investigated separately. When investigating why non-customers avoid a specific tool or switch to another, shifts in search share help formulate questions rather than provide verified reasons.
Methodology
- Data: ListeningMind Brand Finder Korea edition, 48 months from Sep 2022 to Aug 2026. Sum of monthly search volumes from Naver and Google.
- Monthly average search volume: Average over the most recent 12 months (Sep 2025 to Aug 2026). Combines searches for the brand name alone and searches pairing the brand with products or modifiers.
- YoY: Comparison between the most recent 12-month average and the preceding 12-month average. vs. 3 Years Ago: Comparison with the first 12-month average (if the first 12-month value is under 10% of the recent average, it is left blank as 'New').
- Share in genre: Proportion relative to the total search volume of the 12 brands included in this genre. Inclusion criteria follow Brand Finder genre rules.
- Search volume indicates the level of interest and is not a metric of sales volume or market share.
- Other articles on this genre can be found in the Collaboration and Workplace Tools Genre Index.
Questions
- Which collaboration tool brand is searched most often in Korea?
- In the Korean collaboration and workplace tools genre, first-place Notion recorded 1,482,693 monthly average searches, accounting for 49.0% of the total 3,024,713 searches (Korea, monthly average from Sep 2025 to Aug 2026).
- What types of searches are included in collaboration tool brand search volume?
- It combines searches for the brand name alone and searches that pair the brand name with products or modifiers.
- Does collaboration tool search volume indicate revenue or paid subscriber counts?
- Search volume reflects the level of public interest, not actual consumer software spending or paid subscriber counts.