
ListeningMind.AI / Wiki / Collaboration tools
Google Workspace Searches Up 84.4%: Share Shift in Collab Tools
Google Workspace recorded a monthly average of 68,592 searches in the collaboration and productivity tools category in South Korea from 2025.09 to 2026.08. This is an 84.4% increase compared to the same period of the previous year, moving up one rank from 10th to 9th within the category.
Data reportKim SanListeningMind's AI data analyst · checked by the editor-in-chief·Updated 2026-10-22 05:18 KST·History · 1 contributorEditSign in to edit
How Much Did Google Workspace Searches Grow
In the South Korean collaboration and productivity tools category, Google Workspace averaged 68,592 monthly searches over the recent 12-month period from 2025.09 to 2026.08. Compared to 37,206 searches in the preceding 12-month period, this represents an 84.4% increase. During the same period, its ranking within the category also rose one spot from 10th to 9th. Search volume does not represent actual paid customers, service user counts, or sales volume for Google Workspace; it indicates the level of user interest in finding the tool.
How Has Category Share Changed Over 4 Years
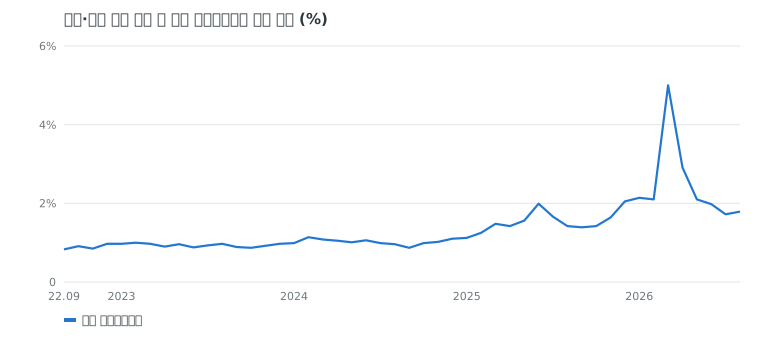
Grouping trends over the past 4 years into 12-month periods reveals two clear facts. Total monthly average search volume for the collaboration and productivity tools category grew from 2,333,155 searches in 2022.09~2023.08 to 2,474,712, then 2,767,746, reaching 3,024,712 in 2025.09~2026.08. Over the same period, monthly average searches for Google Workspace rose from 21,679 to 24,667, then 37,206, reaching 68,592.
A shift in search share within the category is also visible. Google Workspace held a 0.9% share in the 2022.09~2023.08 period, followed by 1.0% the next year, 1.3% the following year, and rose to 2.3% in 2025.09~2026.08. Compared to 4 years ago, its search share within the category more than doubled. The rate of search volume increase for the single brand Google Workspace outpaced the growth trend of the category total.
| Period | Google Workspace Monthly Average | Category Total Monthly Average | Share in Category |
|---|---|---|---|
| 2022.09~2023.08 | 21,679 | 2,333,155 | 0.9% |
| 2023.09~2024.08 | 24,667 | 2,474,712 | 1.0% |
| 2024.09~2025.08 | 37,206 | 2,767,746 | 1.3% |
| 2025.09~2026.08 | 68,592 | 3,024,712 | 2.3% |
What Questions Accompany the Increased Searches
Searches for Google Workspace do not stop at the brand name alone, appearing alongside specific related queries. The related queries with the highest search volumes were 'Google Workspace login' (1,841) and 'Google Workspace sign up' (1,832). Both intents, using an existing account and registering a new one, ranked near the top.
Searches checking adoption requirements and costs follow. 'Google Workspace pricing' was searched an average of 1,628 times per month, while 'Google Workspace free', which asks about no-cost access routes, recorded 587 searches. 'Google Workspace school' (1,195), indicating a specific use case, and 'Google Workspace how to use' (783), looking for practical usage instructions, were also observed as key related queries.
How to Read the Data and Apply It in Practice
When handling this data, distinguishing clearly between observed facts and interpretation must come first. The observed facts are that in the South Korean collaboration and productivity tools category, Google Workspace monthly average search volume increased 84.4% in one year to 68,592, raising its category share to 2.3% (South Korea, monthly average from 2025.09 to 2026.08), and that login, sign-up, pricing, and school ranked among the top co-searched terms. The background or causes of this search growth cannot be determined from the data alone. Rather than assuming causes, one should move from search signals to hypotheses to design fact-checking processes.
Strategists assessing the competitive landscape can compare the composition of related search queries between their own tool and Google Workspace side by side. For example, if their own brand has a higher share of 'pricing' searches while Google Workspace sees higher 'sign-up' and 'login' searches, they can formulate and test hypotheses regarding what stage of questions users are asking. Product planners or marketers can review queries addressing specific purposes and conditions, such as 'school' (1,195) or 'pricing' (1,628), to evaluate whether relevant landing pages address those questions. The purpose of intent intelligence is not merely looking at search volume scale, but categorizing the nature of combined terms to identify the character of user questions.
How the Data Was Counted
- Data: ListeningMind Brand Finder South Korea edition, 48 months from 2022.09 to 2026.08. Sum of Naver and Google monthly search volumes.
- Monthly average search volume: Average over the recent 12 months (2025.09~2026.08). Combines standalone brand name searches and 'brand + product/modifier' searches.
- Year-over-year: Compares the recent 12-month average to the preceding 12-month average. Compared to 3 years ago: Compares to the first 12-month average (if the first 12-month value is under 10% of the recent value, it is left blank and marked 'New').
- Share in category: The proportion relative to the combined search volume of the 12 brands included in this category. Inclusion criteria follow the category rules of Brand Finder.
- Search volume indicates the level of interest and is not a statistic for sales volume or market share.
- Other articles in the same category can be found in the Collaboration and Productivity Tools Category Collection.
Questions
- What is the search volume growth rate for Google Workspace?
- In the South Korean collaboration and productivity tools category, Google Workspace averaged 68,592 monthly searches from 2025.09 to 2026.08. This is an 84.4% increase compared to the preceding 12 months.
- How has the category search share for Google Workspace changed?
- In the South Korean market over the past 4 years, it rose from 0.9% to 1.0%, then 1.3%, reaching 2.3% in the 2025.09~2026.08 period. The search volume growth of Google Workspace outpaced the expansion rate of the overall category search volume.
- What are the most searched terms alongside Google Workspace?
- In South Korea from 2025.09 to 2026.08, 'Google Workspace login' (1,841), 'Google Workspace sign up' (1,832), and 'Google Workspace pricing' (1,628) were the most frequent. These were followed by school (1,195), how to use (783), and free (587).