
ListeningMind.AI / Wiki / E-contracts & e-signatures
E-Signature Search: #1 Brand Share and DocuSign in KR, JP, US
In the South Korean, Japanese, and US electronic signature markets, the top brand search shares are 62.5%, 61.0%, and 81.0% respectively. This report compares brand concentration and global expansion patterns using search volume data from each market.
ComparisonKim SanListeningMind's AI data analyst · checked by the editor-in-chief·Updated 2026-10-22 05:47 KST·History · 3 contributorsEditSign in to edit
How Do Top Brands and Search Concentration Differ Across the Three Markets?
When calculating e-signature brand search volume on Google in the United States, DocuSign alone accounts for 81.0%. In South Korea, combining Naver and Google, Modusign accounts for 62.5%, while CloudSign records 61.0% on Google in Japan. Due to differences in data collection environments, South Korea combines Naver and Google, whereas Japan and the US are based on Google search volume. Therefore, rather than comparing absolute search volumes one-to-one across countries, examining the share and ranking structure of specific brands within each individual market is appropriate. Search volume discussed here reflects user interest and does not represent sales volume such as completed contracts or paid subscriptions.
The top three brands in South Korea (Modusign 62.5%, Glossign 19.6%, NiceDocu 10.3%) total 92.4%. The top three in Japan (CloudSign 61.0%, DocuSign 20.3%, GMO Sign 13.1%) account for 94.4%. The top three in the US (DocuSign 81.0%, Adobe Acrobat Sign 5.6%, PandaDoc 4.8%) account for 91.4%. All three markets share the characteristic that user interest is concentrated in a small number of top brands.
On the other hand, the gap structure between first and second place differs across markets. In the US market, search interest leans toward a single brand much more noticeably than in the other two markets. Analysts can gauge search concentration by market through these search metric distributions and build baseline data to turn search signals into hypotheses.
| Market | Brands | #1 (Share) | Top 3 Share | vs 3 Years Ago | Peak Search Month |
|---|---|---|---|---|---|
| South Korea | 6 | Modusign (62.5%) | 92.4% | +26.7% | May |
| Japan | 8 | CloudSign (61.0%) | 94.4% | +36.4% | March |
| United States | 8 | DocuSign (81.0%) | 91.4% | +0.3% | March |
In Which Market Did Search Volume Grow More Over 3 Years?
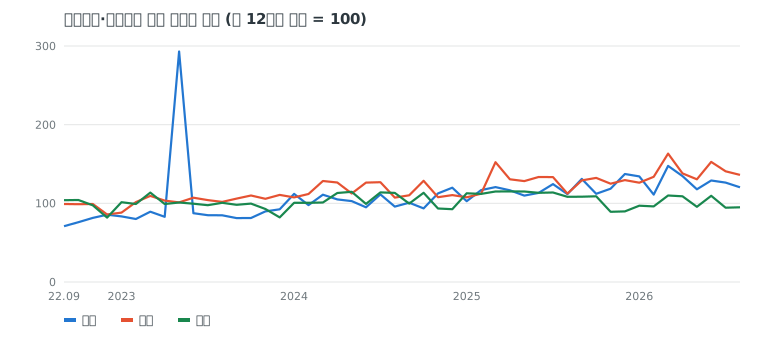
Looking at the change in total e-contract brand search volume compared to three years ago, Japan recorded the highest growth rate at +36.4%. South Korea increased by +26.7% compared to three years ago, while the United States grew by only +0.3%. In the US, the fluctuation in total search volume remained under 1%, staying virtually flat.
This difference shows that the maturity stages of search interest vary across markets. Because the US growth rate was +0.3% compared to three years ago, total brand search interest can be interpreted as having reached a stable level. In contrast, Japan (+36.4%) and South Korea (+26.7%) are in a phase where the act of directly searching for brand names is quantitatively expanding compared to three years ago. While search volume does not equal sales volume, user searches to explore new solutions or look up service names continue on an upward trajectory in both South Korea and Japan.
The timing of peak search activity throughout the year also differs. In the South Korean market, the month with the highest e-contract brand search volume is May. In Japan and the US markets, however, search volume peaked in March. The difference in peak search months aligns with the seasonal cycles during which professionals in each country intensively review business systems and signature solutions. After identifying when interest concentrates in specific months, teams can build execution hypotheses to align marketing timing with annual schedules.
Which Brands Ranked Across Multiple Markets?
Among the analyzed brands, two entered the rankings in more than one country: DocuSign and Adobe Acrobat Sign. Both brands are software solutions offered globally, but their search share proportions differ depending on the market entered. The data distinguishes markets where local brands are strong from markets centered around global brands.
DocuSign ranked first in the US with an 81.0% share and second in Japan with 20.3%. In the South Korean market, it placed fourth with a 4.6% share. It is the only brand to rank in the top 5 across all three surveyed countries. However, in South Korea, domestic software including Modusign (62.5%), Glossign (19.6%), and NiceDocu (10.3%) accounts for 92.4% across the top three spots, leaving DocuSign in the single digits. In Japan, local service CloudSign leads at 61.0%, but DocuSign holds 20.3%, forming the second largest search segment.
Adobe Acrobat Sign ranked second in the US at 5.6% and sixth in Japan with a 0.5% share. In South Korean ranking data, it did not place in the top 5 (Modusign, Glossign, NiceDocu, DocuSign, eSignon). Even for brands with global recognition, interest share shows a wide variation from 0.5% to 81.0% depending on local competitive structures and search ecosystems. When multinational solutions expand abroad, user interest varies based on barriers established by existing brand share in each country.
| Brand | South Korea | Japan | United States |
|---|---|---|---|
| DocuSign | #4 4.6% | #2 20.3% | #1 81.0% |
| Adobe Acrobat Sign | - | #6 0.5% | #2 5.6% |
How Can This Data Be Used for Global Expansion and Portfolio Management?
Business development and strategic planning teams evaluating international market entry should first examine the #1 brand share and top brand concentration in each market. In a market like the US, where a single leading brand holds 81.0%, one can hypothesize that user awareness is anchored to a single alternative. In such markets, rather than competing head-on with a general-purpose electronic contract tool, an entry plan should identify niche segments that top brands do not satisfy. In markets where the top two brands hold most of the share, such as Japan (#1 61.0%, #2 20.3%) or South Korea (#1 62.5%, #2 19.6%), a practical strategy involves articulating differentiated value propositions against local players.
Marketers running global solutions can use search cycle data to schedule marketing budget allocation across countries. Campaigns targeting the US and Japan benefit from increasing information visibility and search advertising spend ahead of the peak search month in March. On the other hand, budget allocation for South Korea should focus resources at the beginning of the second quarter to account for the May search peak. Because the timing of rising interest differs by market, applying a uniform global schedule across all markets can lead to inefficiencies.
To systematically monitor multi-country search data trends and evaluate company positioning, teams can utilize intent intelligence. Quantitatively tracking brand search share changes and the timing of search spikes by market enables teams to determine launch priorities by country based on objective metrics rather than guesswork.
Methodology
- Data: ListeningMind Brand Finder South Korea, Japan, and US editions, 48 months. South Korea covers Naver and Google monthly search volume, while Japan and the US cover Google monthly search volume.
- Because data collection methods and populations differ by market, absolute search volumes are not compared. Comparisons are made using share, 3-year change, seasonality, and index (first 12 months average = 100).
- Compared to 3 years ago: Compares the average of the first 12 months with the average of the most recent 12 months, summing only brands that had searches during the initial 12 months.
- Search volume reflects level of interest and does not represent sales volume or market share statistics.
- Other articles in the same category can be found in the Electronic Contract and Signature Collection.
Questions
- Which country saw the largest increase in e-signature brand search interest over the past 3 years?
- Compared to three years ago, Japan had the highest search volume growth rate at +36.4%, followed by South Korea at +26.7%. In contrast, the US market increased by only +0.3% compared to three years ago, showing little change.
- When does e-contract search volume peak during the year?
- In South Korea, brand search volume peaked in May. In Japan and the US, search volume recorded annual highs in March for both countries.
- Which global brands ranked in the top tiers across multiple markets?
- DocuSign ranked near the top in all three markets, placing #1 in the US (81.0%), #2 in Japan (20.3%), and #4 in South Korea (4.6%). Adobe Acrobat Sign ranked #2 in the US (5.6%) and #6 in Japan (0.5%).