
ListeningMind.AI / Wiki / EVs
EV Search Rankings: Korea, Japan, and the US
In Korea, the top EV search, Tesla Model Y, accounts for only 13.8% of interest, while Japan's bZ4X holds 29.1% and the US Tesla Model 3 takes 22.9%. Over three years, searches rose 85.2% in Korea, but fell 8.1% in the US.
ComparisonKim SanListeningMind's AI data analyst · checked by the editor-in-chief·Updated 2026-10-22 07:08 KST·History · 3 contributorsEditSign in to edit
How top EV search share and concentration vary by market
In the Korean market, Tesla Model Y accounts for 13.8% of searches. While this is the highest among the 15 tracked brands, concentration on a single model is lower than in Japan or the US. In Japan, bZ4X alone makes up 29.1% of all searches across 10 brands. In the US, Tesla Model 3 claims 22.9% across 11 brands.
The combined share of top models highlights these concentration differences further. In Korea, the top three models (Tesla Model Y 13.8%, Kia PV5 12.8%, EV5 10.0%) hold a combined share of 36.6%. In contrast, the top three models in the US (Tesla Model 3 22.9%, Tesla Cybertruck 20.9%, and Rivian R2 14.3%) command 58.1%. In Japan, bZ4X (29.1%), Tesla Model Y (16.9%), and Nissan Leaf (14.8%) reach 60.8% combined.
Differences in search portal usage should be considered first. Korean figures combine Naver and Google searches, while Japan and the US are based on Google search volume. Rather than comparing raw volumes directly across portals, evaluating how user attention splits within each market is more appropriate. Search volume reflects the scale of public interest, not actual product sales volume.
The data shows that users in Korea explore a wider variety of vehicle models evenly. In Japan and the US, interest concentrates around a few top vehicles. This suggests consumers in Korea are still comparing diverse options, whereas information search in Japan and the US has settled around a handful of leading models. Companies entering these markets need to verify the degree of option dispersion when planning launch strategies.
| Market | Brand Count | Top Model (Share) | Top 3 Share | vs 3 Years Ago | Peak Search Month |
|---|---|---|---|---|---|
| Korea | 15 | Tesla Model Y (13.8%) | 36.6% | +85.2% | July |
| Japan | 10 | bZ4X (29.1%) | 60.8% | +28.2% | January |
| US | 11 | Tesla Model 3 (22.9%) | 58.1% | -8.1% | July |
Where did EV search interest grow the most over the past three years
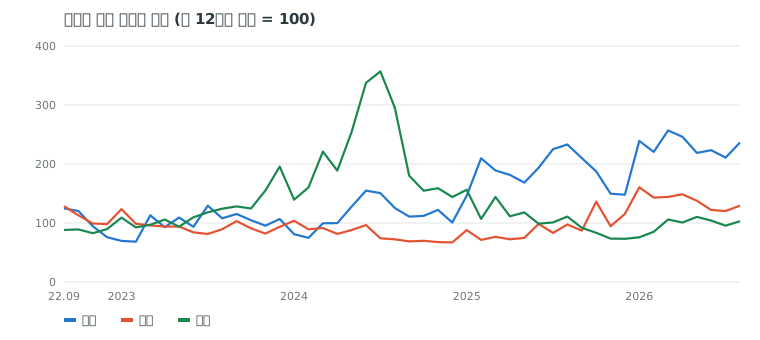
EV search volume in Korea grew 85.2% compared to three years ago. Conversely, the US market declined 8.1% over the same period. Japan saw a 28.2% increase. Among the three markets, Korea experienced the largest surge in interest.
The timing of peak interest also differs by market. Korea and the US recorded the highest search volume in July. Japan reached its peak in January. In Korea and the US, search activity tends to concentrate around mid-year. Japanese users show increased search volume at the start of the calendar year.
The 8.1% decline over three years in the US can be read in relation to market maturity. This decline reflects lower portal search frequency in the US over the three-year period. In contrast, Korea's 85.2% increase indicates that users are actively and repeatedly exploring their options.
Practitioners should adjust advertising schedules around these seasonal fluctuations and long-term trends. Campaigns targeting Korea and the US benefit from concentrating budget around July. For Japan, aligning messaging with early-year search flow is more effective. Marketers must approach products differently depending on whether overall interest in that market is expanding or contracting.
Which EV brands rank near the top across Korea, Japan, and the US
Few models rank near the top across multiple countries. Tesla Model 3 placed in all three markets. It took first place in the US with a 22.9% share, fifth in Japan with 9.5%, and eighth in Korea with 6.5%. While Tesla Model 3 retains a large share in its home market, its ranking and search share are relatively lower in Korea and Japan.
Tesla Model Y posted strong figures in both Korea and Japan. It ranked first in Korea with 13.8% and second in Japan with 16.9%. It did not appear on the US top model list. In Korea and Japan, search interest leans more toward Model Y than Model 3.
Nissan Leaf maintained consistent search presence in Japan and the US. It placed third in Japan with a 14.8% share and eleventh in the US with 4.4%. Among legacy manufacturers, Nissan Leaf is the only model to maintain meaningful share in more than one country.
From a global brand perspective, no single model commands identical interest across every region. While Tesla Model Y attracts significant attention in Korea and Japan, Cybertruck (20.9%) and Model 3 (22.9%) lead searches in the US. Instead of standardizing hero models globally, teams should apply how to turn search signals into hypotheses to prioritize models that match local search share.
| Brand | Korea | Japan | US |
|---|---|---|---|
| Tesla Model 3 | 8th 6.5% | 5th 9.5% | 1st 22.9% |
| Tesla Model Y | 1st 13.8% | 2nd 16.9% | - |
| Nissan Leaf | - | 3rd 14.8% | 11th 4.4% |
Applying search differences to market expansion and brand strategy
Search share and concentration data serve as criteria when prioritizing international expansion. Korea, with a dispersed top-three concentration of 36.6%, provides an easier environment for new entrants to target niche positions.
Marketers managing global brands must tailor model portfolios by country. The US market focuses heavily on sedans (Tesla Model 3 22.9%) and pickups (Tesla Cybertruck 20.9%). In Korea, interest divides across multi-purpose vehicles and SUVs, such as Kia PV5 (12.8%) and EV5 (10.0%). Rather than transposing a uniform lineup from headquarters, teams must examine the segment preferences shown by top search keywords in each market.
These market disparities serve as the basis for building intent intelligence beyond surface metrics. Search volume growth rates also function as indicators of local reception after a launch. In the US, where interest fell compared to three years ago, defensive brand maintenance is required. In Korea, where interest grew 85.2%, supplying informative content to capture early awareness is effective.
Methodology
- Data: ListeningMind Brand Finder Korea, Japan, and US editions, covering 48 months. Korean data combines Naver and Google; Japan and the US reflect Google monthly search volume.
- Because tracking methods and populations differ by market, absolute search volumes are not directly compared. Comparisons use share, 3-year change, seasonality, and an index (first 12 months average = 100).
- Comparison to 3 years ago: Aggregated only brands with search volume in the first 12 months, comparing the first 12-month average to the most recent 12-month average.
- Search volume reflects interest scale and is not a measure of unit sales or market share.
- Related articles in the same genre can be found in the EV genre collection.
Questions
- What is the most notable characteristic of the Korean EV search market?
- Korea (Naver and Google combined) recorded an 85.2% increase in search volume compared to three years ago, the highest growth among the three markets. Its top model, Tesla Model Y, holds 13.8% and the top three total 36.6%, indicating lower concentration on specific models than in Japan or the US.
- Which model holds the highest search share in Japan?
- In Japan (Google), bZ4X ranked first with a 29.1% share. The top three models (bZ4X, Tesla Model Y, Nissan Leaf) account for 60.8% combined, showing that the majority of interest concentrates on a few models.
- Why did EV search volume decline in the US market?
- US EV search volume (Google) dropped 8.1% compared to three years ago. As public interest moved past initial discovery toward routine consideration and purchase, standard portal search frequency likely decreased.