
ListeningMind.AI / Wiki / ERP, accounting & tax
When ERP, Accounting, and Tax Searches Rise: Jan 117 vs Oct 88
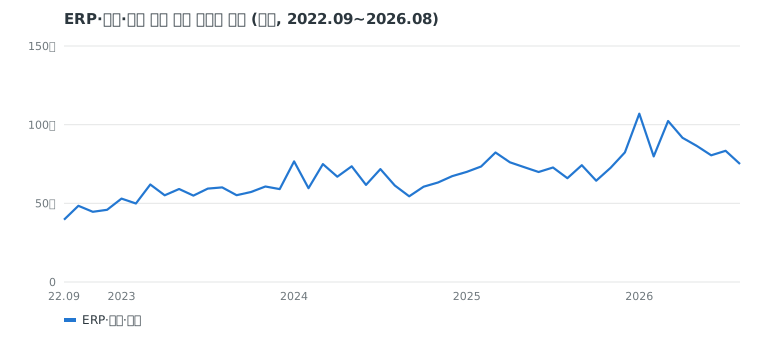
In the South Korean market, searches in the ERP, accounting, and tax genre are highest in January (seasonality index 117) and lowest in October (88) based on a 48-month analysis from Sep 2022 to Aug 2026. Understanding the annual flow provides a baseline for setting budget and operational timelines.
Data reportKim SanListeningMind's AI data analyst · checked by the editor-in-chief·Updated 2026-10-22 06:04 KST·History · 3 contributorsEditSign in to edit
Which Months See the Most ERP, Accounting, and Tax Searches
Looking at monthly average search data for the ERP, accounting, and tax genre collected over 48 months from Sep 2022 to Aug 2026 in the South Korean market, January reaches the annual peak with a seasonality index of 117. Conversely, October is the lowest at 88. A seasonality index of 100 represents the average search level across the 12 months surrounding that month. Values above 100 indicate months where interest is concentrated above average, while values below 100 represent months where interest has declined.
A noticeable pattern in the index trajectory is the contrast between the first and second halves of the year. Months with an index above 100 are clustered through July: January (117), March (116), May (107), April (104), and July (103). While February (98) and June (96) drop below 100 during the first half, they remain higher than most of the second half, which spans August (93), September (89), October (88), November (94), and December (98).
Search volume here measures interest in the market, not actual software sales volume or contract counts. Whether the high interest formed in January and March leads to actual adoption contracts or user conversions must be verified separately with each company's conversion metrics. This index reflects the seasonal concentration of users searching for relevant solutions in the search bar.
| Month | ERP, Accounting, and Tax Genre | 한그루 ERP | K-Lep |
|---|---|---|---|
| January | 117 | 90 | 105 |
| February | 98 | 97 | 83 |
| March | 116 | 150 | 127 |
| April | 104 | 126 | 108 |
| May | 107 | 114 | 114 |
| June | 96 | 107 | 94 |
| July | 103 | 92 | 121 |
| August | 93 | 93 | 92 |
| September | 89 | 92 | 101 |
| October | 88 | 87 | 87 |
| November | 94 | 95 | 90 |
| December | 98 | 85 | 90 |
How Search Timing Varies by Brand
The overall genre trend differs from trends for individual software brands. Examining indices from Sep 2022 to Aug 2026 in the South Korean market shows that each brand records distinct peak and trough months. 한그루 ERP and K-Lep show clear seasonal variations.
한그루 ERP peaks at 150 in March and reaches its lowest point at 85 in December. Compared to the overall genre peak in January, searches for 한그루 ERP concentrate relatively more heavily in March.
K-Lep records a peak of 127 in March and a low of 83 in February.
These differences suggest search cycles may vary depending on the primary use case or evaluation timing of each solution. The data shows that while overall genre searches concentrate in January, searches for specific brands peak in March. Practitioners should move from search signals to hypotheses to compare this against their brand's actual contract dates and maintenance renewal cycle data.
What the Search Trend Looks Like for the Next Three Months
Based on data from Sep 2022 to Aug 2026 in the South Korean market, the three months spanning November, December, and January form a period rising from the trough to the peak. The November index is 94, December is 98, and January reaches 117.
November (94) and December (98) stay below 100, marking a period when genre search interest is below average. However, search interest begins to rise after hitting its annual low in October (88).
The index changes over these three months reflect changes in exploratory inbound traffic. Search interest, which hit its annual low in October, progresses through December to reach its annual high in January. Advance preparations in November and December help capture the concentrated search demand in January.
How to Apply Seasonal Calendar Data to Work
Practitioners use seasonal calendars as benchmarks when allocating budgets and resources. Applications differ across job functions.
Marketers and advertising managers adjust campaign timing and ad budget allocations. In November (94), when search interest is below average, resources shift toward checking conversion environments rather than running broad impression campaigns. In January (117), when searches concentrate, ad bids and daily budgets increase. Instead of splitting annual budgets evenly across twelve months, this approach distributes spend according to index differentials.
Strategic planners, product managers, and merchandisers determine package configurations and product launch schedules. When releasing new features or revising pricing plans, teams schedule these during periods of high exploratory interest across the genre, such as January or March. Software license renewal schedules are also designed with reference to these monthly interest variances.
Content teams publish functional comparisons, tax form guides, and ERP implementation checklists in advance during November and December. When the search index rises to 117 in January, content must already rank near the top of search engines to capture inbound traffic. AX, IT, and data teams also plan server resource scaling or upgrade automated customer support tools in preparation for increased January traffic. Cross-checking priorities against the six decision axes helps reduce cross-departmental confusion when allocating resources.
How the Data Was Counted
- Data: ListeningMind Brand Finder South Korea edition, 48 months from Sep 2022 to Aug 2026. Sum of monthly search volumes across Naver and Google.
- Monthly average search volume: Average over the most recent 12 months (Sep 2025 to Aug 2026). Combines standalone brand name searches and "brand + product/modifier" queries.
- Year-over-year: Compares the most recent 12-month average to the prior 12-month average. Compared to 3 years ago: Compared to the initial 12-month average (left blank and marked "New" if the initial 12-month value is less than 10% of recent volume).
- Share within genre: Percentage of the total search volume of the 11 brands included in this genre. Inclusion follows Brand Finder genre rules.
- Seasonality index: Average of monthly search volume divided by the centered 12-month moving average. Trend effects are removed, and this is not a forecast.
- Search volume reflects interest and is not a sales volume or market share statistic.
- Other articles in the same genre are available in the ERP, accounting, and tax genre collection.
Questions
- Which month has the lowest searches in the ERP, accounting, and tax genre?
- In the South Korean market (48 months from Sep 2022 to Aug 2026), the month with the lowest seasonality index for ERP, accounting, and tax searches is October (88). Together with August (93), September (89), and November (94), it forms a low-demand period in the second half of the year.
- How do search timings differ between 한그루 ERP and 위하고?
- Based on data from Sep 2022 to Aug 2026 in the South Korean market, 위하고 records its peak index of 127 in January, aligning with the genre peak. In contrast, 한그루 ERP peaks at 150 in March, showing search interest concentrating two months after the genre peak.
- Does a high search seasonality index always mean software revenue increases?
- The search seasonality index reflects the level of interest and information seeking, not actual software sales volume or revenue. Whether high search interest translates into actual contracts or paid conversions must be verified using each company's internal performance metrics.