
ListeningMind.AI / Wiki / Golf (clubs & wear)
Months with High and Low Golf (Club and Apparel) Searches (Korea, 48 Months)
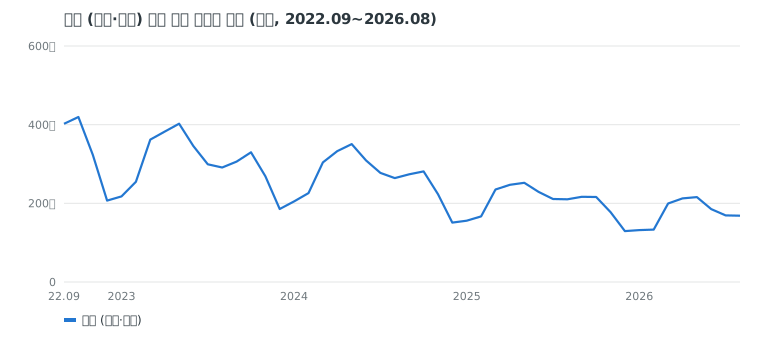
Searches for Golf (clubs and apparel) in Korea reach an annual peak in May with a seasonal index of 127 and fall to their lowest in December at 66. Monthly seasonal indices across 48 months from 2022.09 to 2026.08 show the annual flow of interest.
Data reportKim SanListeningMind's AI data analyst · checked by the editor-in-chief·Updated 2026-10-22 06:31 KST·History · 2 contributorsEditSign in to edit
Which Month Has the Most Searches for Golf (Clubs and Apparel)?
Looking at search trends in the Golf (clubs and apparel) genre in the Korean market, May records the highest figure of the year. Based on the 48 months from 2022.09 to 2026.08, the genre seasonal index rises to 127 in May. A seasonal index of 100 represents the 12-month moving average centered on that month.
Looking at monthly trends, the index stays below the baseline at 76 in February and crosses above the baseline to 110 in March. It then rises to 127 in May. Although it drops to 114 in June, it remains above 100. August nears the baseline at 101. In October, during the fall period, it rises again to 112.
This metric shows two rising periods during the year: the first period running from March to May, and the second period peaking in October. The peak of the March to May period is May (127), and the peak of the second period is October (112). The rise in the first period is larger than that in the second period. Search volume data reflects the level of consumer interest and is not identical to product sales volume. Practitioners must distinguish this difference and read demand cycles from the perspective of intent intelligence.
| Month | Golf (Clubs and Apparel) Genre | G/FORE | Southcape |
|---|---|---|---|
| January | - | 55 | 59 |
| February | 76 | 68 | 71 |
| March | 110 | 116 | 97 |
| April | - | 130 | 114 |
| May | 127 | 138 | 140 |
| June | 114 | 120 | 122 |
| July | - | 102 | 122 |
| August | 101 | 99 | 116 |
| September | - | 110 | 113 |
| October | 112 | 116 | 105 |
| November | - | 88 | 82 |
| December | - | 54 | 60 |
Which Brands Show Large Seasonal Variations in Search Volume?
Individual brand search index fluctuations appear larger than the trend for the genre as a whole. Brands with notable seasonal differences in the Korean Golf (clubs and apparel) market are G/FORE, Southcape, and Malbon Golf.
Southcape records its highest index of 140 in May and its lowest of 59 in January. G/FORE rises to a peak of 138 in May before dropping to a low of 54 in December. Malbon Golf records a high of 135 in May and falls to 59 in January, showing a gap of 76 points.
All three brands share May as the point where they reach their peak. The May indices of all three brands are higher than the May peak for the overall genre (127). In contrast, the months with the lowest figures diverge. G/FORE records its annual low in December (54), whereas Southcape and Malbon Golf record their lowest numbers in January (59). The lowest month differs by one month depending on the brand.
The fact that certain brands exhibit wider search fluctuations than the genre average indicates that consumers search more heavily for specific brands during specific periods. Whether this translates into actual brand sales differences requires separate verification with sales performance data. Search index analysis only confirms the concentration of interest.
What Is the Search Trend for the Upcoming Three Months?
In Korea, based on data from 2022.09 to 2026.08 in the Golf (clubs and apparel) genre, the index that stood at 112 in October stays below the baseline moving into the year-end and early-year period.
G/FORE drops from 116 in October to 88 in November and 54 in December, followed by 55 in January. Southcape similarly declines from 105 in October to 82 in November and 60 in December, recording 59 in January. In individual brand data, December and January emerge as the period with the lowest indices of the year.
The reason to watch this period is to identify the baseline point within the downward trend. Practitioners use the low metrics observed across the year-end and early-year period to form hypotheses from search signals and plan for the next cycle.
How to Apply Golf Season Calendar Data to Business Practice
Monthly seasonal indices are used directly in enterprise practice to determine campaign timing, allocate advertising budgets, manage inventory and inbound shipments, and plan content publication.
Marketers and advertising managers run advance acquisition campaigns between February (76) and March (110), when search metrics begin to climb. Because consumer interest peaks in May (127), concentrating advertising budgets between March and May aligns with the data. Conversely, at year-end when the index falls, it serves as a baseline to adjust performance advertising execution volume.
MDs and product planners align inbound schedules with the calendar. Because the genre index crosses 100 in March (110), logistics inbound shipments and product registrations must be completed before the index rises. Furthermore, for brands with large May swings such as G/FORE (138), Southcape (140), and Malbon Golf (135), inventory management is necessary to prepare for concentrated demand in April and May.
Content managers focus on the leading nature of the search index. After passing through the lows of the year-end and early year, the index shifts sharply from February (76) to March (110), so they plan to release new golf-related content incrementally starting when the index rebound begins. Strategic planning and AX organizations input this data into the six decision axes system to configure automated alert rules for genre index fluctuations.
Methodology
- Data: ListeningMind Brand Finder Korea edition, 48 months from 2022.09 to 2026.08. Total monthly search volume across Naver and Google.
- Monthly average search volume: Average over the most recent 12 months (2025.09 to 2026.08). Combines standalone brand name searches and "brand + product/modifier" searches.
- Year-over-year: Compares the recent 12-month average with the preceding 12-month average. Compared to three years ago: Compares with the first 12-month average (if the first 12 months are less than 10% of recent volume, left blank and marked "New").
- Share within genre: Proportion relative to the combined search volume of the 22 brands included in this genre. Inclusion follows Brand Finder genre rules.
- Seasonal index: Average value obtained by dividing each month's search volume by the 12-month moving average centered on that month. Excludes trend effects and is not a forecast.
- Search volume reflects interest and is not a sales volume or market share statistic.
- Other articles in the same genre can be found in the Golf (Clubs and Apparel) Genre Hub.
Questions
- Which months have a Golf search index above 100?
- Based on Korean market data from 2022.09 to 2026.08, a total of 8 months have an index of 100 or higher: March (110), April (120), May (127), June (114), July (102), August (101), September (107), and October (112).
- Which months have the highest and lowest seasonal index in the Golf genre?
- In the 48-month analysis of the Korean Golf (clubs and apparel) genre from 2022.09 to 2026.08, the month with the highest seasonal index is May (127). In contrast, the month with the lowest index in the annual trend is December (66). This index is normalized so that the 12-month moving average centered on the target month equals 100.
- Which brands show notable seasonal index differences?
- According to data from 2022.09 to 2026.08 in the Korean Golf (clubs and apparel) genre, Southcape, G/FORE, and Malbon Golf show wide fluctuations. Southcape recorded a high of 140 in May and a low of 59 in January. G/FORE recorded a high of 138 in May and a low of 54 in December, and Malbon Golf recorded a high of 135 in May and a low of 59 in January.
- What is the Golf seasonal index for the upcoming three months?
- Looking at the 2022.09 to 2026.08 trend for the Korean Golf (clubs and apparel) genre, the seasonal indices for the upcoming three months are November 93, December 66, and January 71. All three months remain below the baseline of 100. Among these, December (66) has the lowest index across the entire genre for that period.
- How is seasonal index data used in practical business operations?
- Seasonal index data from 2022.09 to 2026.08 in the Korean Golf (clubs and apparel) market is used to schedule execution timelines across different business functions. It informs campaign timing and ad budget allocation. In addition, it is used when planning inventory and inbound schedules, as well as deciding when to publish content.