
ListeningMind.AI / Wiki / Outdoor wear
Months with high and low outdoor wear searches (South Korea, 48 months)
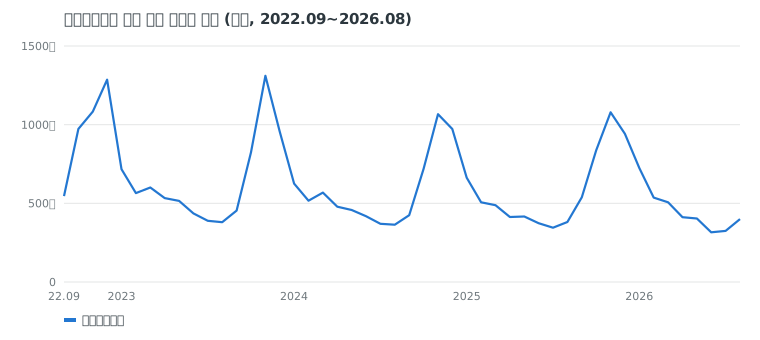
The outdoor wear search index in South Korea peaks at 194 in November and drops to 61 in July (based on the 48 months from 2022.09 to 2026.08). Reviewing search trends in advance makes it easier to set execution timing for marketing and inventory planning.
Data reportKim SanListeningMind's AI data analyst · checked by the editor-in-chief·Updated 2026-10-22 07:28 KST·History · 2 contributorsEditSign in to edit
Which Month Has the Most Outdoor Wear Searches?
In the South Korean outdoor wear market (2022.09 to 2026.08), the search index is highest in November. Compared to the baseline of 100 (the 12-month average centered on that month), a significant amount of interest concentrates in this single month. In contrast, July sees the lowest level of the year. The data collected over 48 months shows a clear seasonal shift in consumer interest.
The first noticeable point is the shift from September to October. The September index stays at 79, but rises significantly in October. This indicates that consumer search behavior increases in early fall. Search volume represents the scale of interest rather than product sales. This trend shows search interest building in October toward its November peak.
The second characteristic is the winter concentration. The index exceeds 100 only during the four months from October through January (115) of the following year. It stays below 100 for the other eight months. It continues with low index numbers through February (89) and March (90), down to August (62). Even though there is demand for spring and summer outdoor activities, searches for 'outdoor wear' heavily concentrate on the winter cold-weather clothing preparation period.
| Month | Outdoor Wear Genre | The North Face | Eider |
|---|---|---|---|
| January | 115 | 128 | 96 |
| February | 89 | 86 | 66 |
| March | 90 | 75 | 85 |
| April | 77 | 56 | 73 |
| May | 76 | 51 | 71 |
| June | 68 | 47 | 61 |
| July | 61 | 40 | 48 |
| August | 62 | 47 | 46 |
| September | 79 | 76 | 63 |
| October | 133 | 138 | 132 |
| November | 194 | 254 | 256 |
| December | 162 | 210 | 200 |
Which Brands Are Most Affected by Seasonality?
Individual brands show wider fluctuations than the overall genre index. In the case of The North Face, the November peak index reaches 254, but drops to 40 in July. Interest falls below half the average during summer, while more than two and a half times the average concentrates in the winter peak season.
Eider shows a similar pattern. Its peak index reaches 256 in November, and its lowest index stays at 46 in August. Compared to The North Face, it traces a similar trajectory in peak heights and off-season lows. NEPA also peaks at 206 in November and reaches its lowest point at 50 in August. All three brands share a cycle that peaks in November and bottoms out in July or August.
This phenomenon reflects consumer recall centering on winter padding and heavy outerwear rather than fluctuations in brand awareness. To understand the gap between searching for a brand and actually purchasing a product, tracking changes in search queries entered into the search box based on intent intelligence is necessary.
How Will Search Trends Change Over the Next Three Months?
In the South Korean outdoor wear market (2022.09 to 2026.08), the three months from November to January form the core winter search period. The seasonal index for January stands at 115. While all three months remain above the baseline of 100, the index follows a downward trajectory month by month. The peak occurs in November.
November is the month with the highest concentration of interest throughout the year. Consumers begin searching as they prepare for new product releases and winter outerwear purchases. The December index drops compared to November, but remains well above the baseline. This period carries continuous demand for midwinter cold protection and year-end gifts. In January, the index records 115, entering the tail end of the peak season.
This trend provides marketing teams with clear priorities. November requires large-scale exposure to capture early demand, while December calls for actions focused on purchase conversions. For January, promotions help absorb remaining winter demand and prevent excess inventory from carrying over into the next season.
How to Apply Seasonal Calendar Data in Practice
The monthly seasonal index serves as a baseline that aligns internal teams around the same timing. Advertising teams use this metric to decide budget deployment periods. Starting ad exposure in late September (79), when the index begins to rise, or early October helps secure placement within the brand consideration set during the November peak season. Launching campaigns only after November arrives risks missing customers in the discovery phase.
Merchandisers and product planners reference search metrics when scheduling inventory and stock arrivals. If large inventory volumes arrive in January (115) and February (89) as consumer interest declines, clearing stock becomes difficult. Conversely, warehouse stocking of core items and online product detail page preparation must be completed before October, when interest picks up, to capture initial checkout momentum.
Content publishing and search optimization should also align with the calendar. Publish information focused on new winter product specifications and sizing tips in October, and highlight cold-wave wear reviews or year-end benefit content in December. When establishing a data-driven decision-making framework, reviewing the six decision axes helps create a strategy that balances brand resources across the peak season.
How We Counted
- Data: ListeningMind Brand Finder South Korea edition, 48 months from 2022.09 to 2026.08. Total monthly search volume from Naver and Google.
- Monthly average search volume: Average over the most recent 12 months (2025.09 to 2026.08). Combines standalone brand searches with 'brand + product/modifier' queries.
- YoY: Comparison of the most recent 12-month average with the previous 12-month average. Vs. 3 years ago: Comparison with the first 12-month average (left blank and marked 'New' if the first 12-month value is under 10% of recent volume).
- Share within genre: Percentage of the total search volume of the 18 brands included in this genre. Inclusion criteria follow Brand Finder genre rules.
- Seasonal index: Average of each month's search volume divided by the 12-month moving average centered on that month. This removes trend effects and is not a forecast.
- Search volume represents the scale of interest, not sales volume or market share statistics.
- Other articles in the same genre can be found in the outdoor wear genre collection.
Questions
- Which month has the highest outdoor wear search index in the year?
- In the South Korean outdoor wear market (based on 2022.09 to 2026.08), the month with the highest seasonal index is November, recording 194. It peaks at 194 in November from 133 in October, followed by 162 in December.
- Are brand searches like The North Face or Eider also highest in November?
- Yes. In the South Korean market (2022.09 to 2026.08), The North Face recorded 254 in November (lowest: 40 in July) and Eider recorded 256 in November (lowest: 46 in August), showing a higher November concentration than the overall genre index (194).