
ListeningMind.AI / Wiki / Apparel
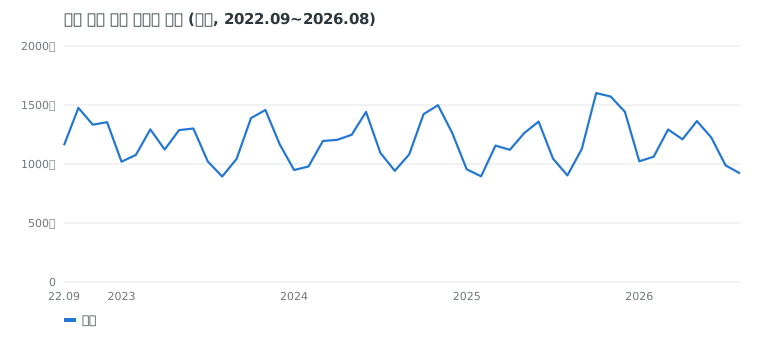
High and Low Search Months for Apparel (South Korea, 48 Months)
The search index for the apparel genre in South Korea peaks in November at 127 and drops to its lowest in August at 77 (South Korea, Sep 2022 to Aug 2026, 48-month seasonality index). Search volume represents consumer interest, not sales volume.
Data reportKim SanListeningMind's AI data analyst · checked by the editor-in-chief·Updated 2026-10-22 06:47 KST·History · 3 contributorsEditSign in to edit
When Does Apparel Search Volume Peak?
In the South Korean apparel market (Sep 2022 to Aug 2026), the apparel search seasonality index is highest in November across all twelve months. In contrast, August falls to 77. A seasonality index of 100 represents the average search volume across the 12 months centered on that month.
Looking at the annual trend, two upward phases appear. The first rise occurs across May (107) and June (115). After declining through July (89) and August (77), the index rebounds starting in September (91) and rises to elevated levels in October and November. In December, it remains above the baseline of 100. It then drops back below the baseline in January (82) and February (82).
This data aggregates queries entered into search engines. Search volume indicates the level of consumer interest and does not directly represent actual product sales volume or transaction revenue. It serves as a benchmark for understanding the time lag between search behavior and purchasing behavior.
| Month | Apparel Genre | TOPTEN10 | UNIQLO |
|---|---|---|---|
| January | 82 | 62 | 76 |
| February | 82 | 54 | 73 |
| March | 103 | 79 | 88 |
| April | 97 | 87 | 87 |
| May | 107 | 106 | 111 |
| June | 115 | 109 | 108 |
| July | 89 | 91 | 74 |
| August | 77 | 67 | 64 |
| September | 91 | 68 | 87 |
| October | 123 | 219 | 128 |
| November | 127 | 156 | 181 |
| December | 108 | 94 | 121 |
How Do Peak Search Periods Differ by Brand?
There are differences between the overall genre trend and the patterns shown by individual brands. Comparing brand variations shows that peak interest points diverge. TOPTEN10 records its annual peak index in October, reaching 219. Conversely, its lowest month is February at 54. The gap between its highest and lowest index is roughly fourfold.
UNIQLO reaches its highest index of 181 in November and its lowest of 64 in August. UNIQLO's peak coincides with November, when the overall apparel genre index is highest. The search index volatility of individual brands is greater than that of the genre as a whole.
ZARA shows a different pattern. ZARA's peak index appears in the summer period in June at 169. Its lowest index is recorded in August at 67. This contrasts with the overall genre peak in November. Depending on the brand, consumer search timing is dispersed across October, November, and June. These differences in patterns serve as an evidence base for assessing brand-specific demand timing through Intent Intelligence.
What Is the Search Trend for the Upcoming Three Months?
The upcoming three months follow the sequence of November, December, and January. This is a downward phase that gradually declines after the annual peak and falls below the baseline.
November is the most active month of the year for apparel exploration. The subsequent December figure is lower than November but still exceeds the baseline value of 100. It shows that search demand does not drop off abruptly and maintains a certain level through year-end.
The shift becomes prominent in January, when the seasonality index drops to 82. Moving past November and December when search interest is concentrated, the frequency of searches for apparel brands and products slows down in January. When interpreting data, plans for the next quarter should be established based on these metric shifts.
How Is Seasonality Calendar Data Used in Practice?
The seasonality calendar provides a reference point for marketing, advertising, merchandising, and data practitioners making timing-related decisions. Marketers review search indexes when scheduling campaigns. Launching a campaign right before search volume reaches its peak helps capture incoming attention early. If the trend peaks in November, campaign launch timing is determined by tracking index changes in September and October.
Advertising managers build ad budget allocation plans. During months with lower-than-average interest such as July (89), August (77), January (82), and February (82), they adjust impression bids, while concentrating and deploying budget in October and November when interest peaks. This reduces the inefficiency of spending excessive funds during periods of declining search interest.
Merchandisers and product planners use this data to coordinate inventory management and stocking schedules. Because search data tends to precede purchasing behavior, they ensure stocking schedules do not lag behind search peaks. Between late December and January, when search demand drops, they adjust the volume of new inventory intake.
Content creators map out content publishing schedules in advance. If searches for a particular brand surge in June or October, related content must be published and indexed by search engines before those months arrive. Teams take an approach that moves from search signals to hypotheses, preventing cross-functional scheduling conflicts and aligning execution timing.
Methodology
- Data: ListeningMind Brand Finder Korea edition, 48 months from Sep 2022 to Aug 2026. Sum of monthly search volumes across Naver and Google.
- Average monthly search volume: Average of the most recent 12 months (Sep 2025 to Aug 2026). Combines standalone brand name searches and "brand + product/modifier" queries.
- Year-over-year: Compares the average of the most recent 12 months to the preceding 12 months. Versus 3 years ago: Compares to the first 12-month average (left blank and marked "New" if the first 12-month value is less than 10% of recent volume).
- Share within genre: Ratio against total search volume of the 29 brands included in this genre. Inclusion criteria follow Brand Finder genre rules.
- Seasonality index: Average of each month's search volume divided by the 12-month moving average centered on that month. Adjusted to remove trend effects and not a forecasted value.
- Search volume indicates level of interest, not sales volume or market share statistics.
- Other articles in this genre can be found in the Apparel Genre Collection.
Questions
- Which months have the highest and lowest apparel search index?
- Based on the 48-month analysis of the South Korean market from Sep 2022 to Aug 2026, the apparel genre seasonality index peaks in November (127) and reaches its lowest point in August (77). Search volume reflects consumer interest rather than sales volume.
- Do all brands experience their search peaks at the same time?
- No. In the South Korean market data from Sep 2022 to Aug 2026, UNIQLO peaked in November (181), while TOPTEN10 reached its highest index in October (219) and ZARA in June (169).
- How does apparel search volume trend across November, December, and January?
- The South Korean apparel seasonality index gradually declines from 127 in November to 108 in December, then drops to 82 in January. Search interest remains above the baseline through year-end before falling below it in January.