
ListeningMind.AI / Wiki / Domestic destinations
Peak and Low Months for Domestic Travel Searches in South Korea
Searches for domestic travel destinations in South Korea peak in July with a seasonality index of 128 and hit an annual low of 78 in November (48 months from Sep 2022 to Aug 2026).
Data reportKim SanListeningMind's AI data analyst · checked by the editor-in-chief·Updated 2026-10-22 07:27 KST·History · 3 contributorsEditSign in to edit
When Are Domestic Travel Destination Searches Highest?
In the South Korean market, searches in the domestic travel destination genre peak in July with a seasonality index of 128, the highest in the year (South Korea, 48 months from Sep 2022 to Aug 2026). In contrast, the seasonality index in November is the lowest of the year. The period exceeding the baseline of 100 (the 12-month centered moving average) spans four months: May (108), June (104), July (128), and August (123). After dipping below the baseline in September (95) and October (96), the index remains at low levels through November and December before slowly rebounding through January (95), February (99), March (91), and April (99).
Two key characteristics emerge from these indicators. First is the concentration of demand from May through August. The trajectory rising to 108 in May and up to 128 in July shows that early summer outings and summer vacation planning continue in search boxes for four months. Second is the decline in demand transitioning from autumn to early winter. The figure drops from 96 in October toward November, marking the annual low. Search volume is not identical to product sales volume or actual visitor counts; it indicates the scale of search intent. Therefore, 128 in July indicates that search behavior for travel destinations is most concentrated at this point.
Practitioners should read the index increase in May as a signal. If marketing begins only after reaching July, it is easy to miss the intent of users who have already been exploring destinations since May and June. When factoring the fluctuations in search demand into planning, checking the six decision axes makes it easier to systematically calculate the time lag between the exploration phase and the actual booking phase.
| Month | Domestic Travel Destination Genre | Sokcho | Gangneung |
|---|---|---|---|
| Jan | 95 | 94 | 111 |
| Feb | 99 | 95 | 106 |
| Mar | 91 | 73 | 82 |
| Apr | 99 | 84 | 87 |
| May | 108 | 102 | 101 |
| Jun | 104 | 114 | 111 |
| Jul | 128 | 152 | 146 |
| Aug | 123 | 143 | 131 |
| Sep | 95 | 89 | 76 |
| Oct | 96 | 88 | 79 |
| Nov | 78 | 73 | 73 |
| Dec | 86 | 91 | 98 |
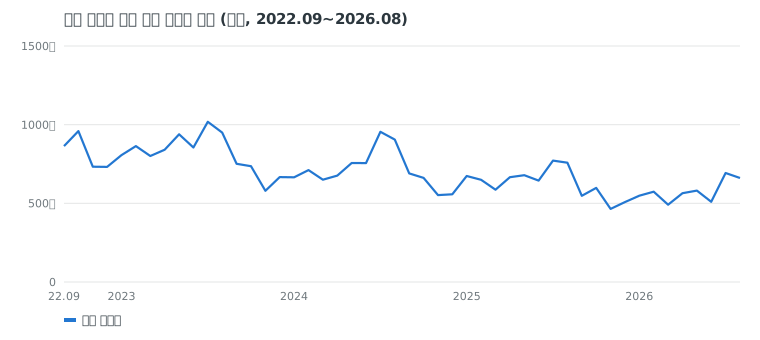
Which Brands and Regions Are Most Affected by Seasonality?
Major domestic travel destination brands show wider seasonal fluctuations in search volume than the overall genre average. Sokcho reaches a peak index of 152 in July and annual lows in March and November. Gangneung peaks at 146 in July and records its annual low in November. Yeosu also records a peak of 140 in July and a low of 70 in November, showing a 70-point gap (South Korea, 48 months from Sep 2022 to Aug 2026).
That all three regions peak in July aligns with the overall genre trend. However, differences appear in the timing of their lowest points. Gangneung and Yeosu record their lowest points in November, mirroring the overall genre, whereas Sokcho hits its low point in March as well as November. This suggests that even among coastal areas, the timing when visitor search intent drops can differ by location.
During periods when a specific destination index drops, fewer users search for that brand. Rather than viewing this off-peak period as mere stagnation, practitioners need to formulate and test hypotheses regarding under what conditions non-customers who do not typically search for the brand might reconsider winter seas or early spring travel destinations.
How Will Search Demand Move Over the Next Three Months?
The seasonality index for the upcoming three months moves through November and December toward 95 in January (South Korea, 48 months from Sep 2022 to Aug 2026). November is the month when searches for domestic travel destinations decrease the most during the year. However, it shifts to an upward trend in December and recovers to 95 in January. While it falls short of the baseline of 100, it marks a phase of bottoming out and rising.
These three months coincide with the year-end season, New Year holidays, and winter school breaks. November reflects a period of declining searches for immediate travel. The subsequent movement through December and to 95 in January can be interpreted as a gradual resurgence of searches related to year-end gatherings, sunrise trips, and winter leisure. Rather than suspending all advertising based solely on the low November figure, it is advisable to prepare search keywords set to rebound in December and January.
Examining long-term data shows that after January (95) and February (99), searches slow temporarily in March (91) before entering the peak-season trajectory starting in April (99). The upcoming three months are not a downtime for marketing programs, but rather a preparation window to reorganize product assortments and keyword strategies ahead of the demand expansion starting in May of the following year.
How to Apply Seasonal Calendar Metrics to Business Practice
The seasonality index serves as an objective reference point when allocating advertising budgets, scheduling campaign execution, managing inventory, and planning content publishing. The approach to interpreting these metrics should vary slightly across roles.
Advertising managers and media planners use the seasonality index as a guideline for bid prices and budget allocation. In November, when the index drops to the annual low, reducing bids on high-cost keywords prevents unnecessary budget depletion; expanding budget allocation from May as the index climbs to 108 secures conversion opportunities. Because competition is fierce at the July peak (128), a recommended strategy is to capture exploring customers early in May and June (104), when unit costs are comparatively stable.
Product planners and merchandisers schedule inventory sourcing and product stocking cycles one to two months ahead of the seasonal index curve. In addition, given brand-specific variations, such as Sokcho bottoming out in March and November and Yeosu in November (70), practitioners should differentiate the timing of packages tailored to the off-season.
Content planners align publishing schedules with search rebound periods. Leading into the rebound from the November low toward December and January (95), content on winter scenic drives and sunrise spots should be published sequentially starting in mid-November. Developers and analysts who want to connect precise demand fluctuations directly to their systems can integrate the API to automatically update monthly search indices in internal databases and automate decision-making processes.
How the Data Was Counted
- Data: ListeningMind Brand Finder South Korea edition, 48 months from Sep 2022 to Aug 2026. Sum of monthly search volumes on Naver and Google.
- Monthly average search volume: Average of the most recent 12 months (Sep 2025 to Aug 2026). Combines standalone brand searches and "brand + product/modifier" searches.
- Year-over-year: Compares the most recent 12-month average to the prior 12-month average. Versus three years prior: Compares to the first 12-month average (left blank and marked "New" if the first 12 months are less than 10% of the recent figure).
- Share within genre: Ratio against the sum of search volumes across the 23 brands included in this genre. Inclusion criteria follow Brand Finder genre rules.
- Seasonality index: Average of the search volume of each month divided by the 12-month moving average centered on that month. Trend effects are removed, and this is not a forecast.
- Search volume reflects the level of interest and is not a statistic for sales volume or market share.
- Other articles in the same genre can be found in the Domestic Travel Destination Genre Collection.
Questions
- Which region shows the largest summer search fluctuation?
- Sokcho records the highest peak with a July seasonality index of 152, showing a 79-point gap compared to its annual low in March (73) (analysis of 48 months from Sep 2022 to Aug 2026, South Korea). Gangneung (July 146, November 73) and Yeosu (July 140, November 70) also show large seasonal variations of 70 points or more.
- How does demand change over the next three months from November to January?
- The domestic travel destination genre in South Korea records its annual low in November with a seasonality index of 78, then gradually rebounds to 86 in December and 95 in January (analysis of 48 months from Sep 2022 to Aug 2026). While below the baseline of 100, this period marks a gradual recovery in year-end and New Year demand following the early winter dip.
- When are overall domestic travel searches highest and lowest during the year?
- Based on 48 months from Sep 2022 to Aug 2026 in the South Korean market domestic travel destination genre, the month with the highest seasonality index is July (128). Conversely, the lowest month observed is November (78). This index represents interest levels relative to the 12-month surrounding average set at 100, and does not indicate sales volume.
- In which month is the seasonality index for Sokcho lowest?
- In 48-month data from Sep 2022 to Aug 2026 for the South Korean domestic travel destination genre, the lowest seasonality index for Sokcho is 73 in March. During the same period, Sokcho's highest seasonality index is confirmed at 152 in July. This trend differs from Gangneung and Yeosu, which record their lowest figures in November.
- How are the seasonality index findings applied in business practice?
- The seasonality index for the domestic travel destination genre in South Korea (48 months from Sep 2022 to Aug 2026) is used to determine campaign timing and advertising budget allocations. It is also applied across roles planning inventory sourcing cycles and finalizing content publishing schedules.