
ListeningMind.AI / Wiki / Coffee & cafés
Starbucks search trends and user journey in South Korea
When deciding keywords and landing pages for Starbucks search ads, you need to look not only at brand search volume but also at the information searched afterward. In the South Korean coffee and cafe genre from September 2025 to August 2026, Starbucks recorded an average monthly search volume of 2,435,360 and a 27.8% share within the genre. In a sample of 30 search paths, queries for recruitment i
Data reportKim SanListeningMind's AI data analyst · checked by the editor-in-chief·Updated 2026-10-22 13:27 KST·History · 4 contributorsEditSign in to edit
Where does Starbucks stand in the coffee and cafe genre?
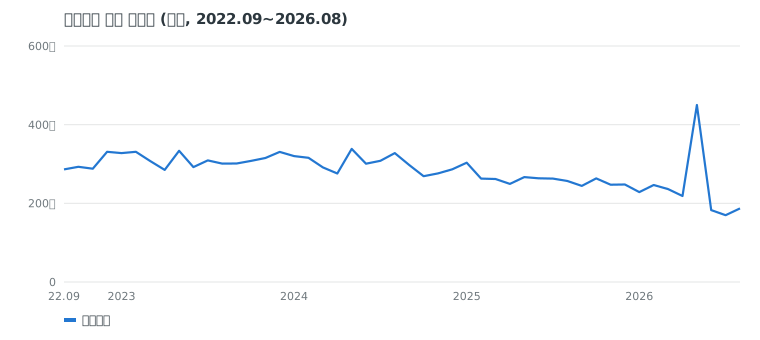
When comparing brand search volume with competing brands, look at both rankings within the genre and changes over time. From September 2025 to August 2026, Starbucks maintained its rank of 1st in search volume in the South Korean coffee and cafe genre, following the previous year.
While it maintained its rank within the genre, search volume decreased. Based on monthly averages from September 2025 to August 2026 in South Korea, Starbucks search volume decreased by 10.2% compared to the previous year and 20.7% compared to three years earlier.
To interpret a decrease in search volume as a decrease in brand usage, you must also check usage data outside search portals. Search data on this page alone cannot explain the reason for the decline. The next step is to compare changes in mobile app active user metrics and payment data to see whether search volume and actual usage moved in the same direction.
| Period | Monthly Average Search Volume | Rank in Genre |
|---|---|---|
| Sep 2022 to Aug 2023 | 3,071,059 | - |
| Sep 2023 to Aug 2024 | 3,111,057 | - |
| Sep 2024 to Aug 2025 | 2,713,458 | 1 |
| Sep 2025 to Aug 2026 | 2,435,360 | 1 |
What do people search for along with Starbucks?
When selecting keywords for search advertising, you should separate searches for the brand name alone from searches seeking specific information. The search volume for "Starbucks" entered alone in the South Korean market averaged 1,515,258 per month (Sep 2025 to Aug 2026), accounting for more than half of the total search volume of 2,435,360. Keywords attached to the brand name reveal what information is sought, such as menus, merchandise, and store visits.
Among related search queries, the keyword with the highest volume was "Starbucks menu," recording a monthly average of 240,058. It was followed by "Starbucks tumbler" (133,738). Next were "Starbucks cake" (27,764), "Starbucks DT" (25,148), "Starbucks Tank Day" (23,506), "Starbucks store music" (22,123), "Starbucks near me" (20,686), "Starbucks Aerocano" (20,349), "Starbucks size" (19,180), and "Starbucks new menu" (18,912).
Related search queries include searches about promotions and store experience, as well as product information. Beyond beverages, searches for in-store music also appear, such as "Starbucks store music" (22,123). Specific menu names like "Starbucks Aerocano" and promotion names like "Starbucks Tank Day" have higher search volumes than "Starbucks new menu." From an Intent Intelligence perspective, such differences serve to distinguish guidance content needed for products, promotions, and store experience.
| Associated Search Query | Monthly Average Search Volume |
|---|---|
| Starbucks menu | 240,058 |
| Starbucks tumbler | 133,738 |
| Starbucks cake | 27,764 |
| Starbucks DT | 25,148 |
| Starbucks Tank Day | 23,506 |
| Starbucks store music | 22,123 |
| Starbucks near me | 20,686 |
| Starbucks Aerocano | 20,349 |
| Starbucks size | 19,180 |
| Starbucks new menu | 18,912 |
What are the age and gender demographics of consumers searching for Starbucks?
When reviewing gender targeting for search ads, compare the composition of brand searchers with that of searchers across the entire genre. Based on monthly averages in South Korea from September 2025 to August 2026, the female share of Starbucks searchers was 68.4%, lower than the coffee and cafe genre average of 70.0%.
By age group, searchers in their 40s accounted for 30.6%, higher than the genre average of 29.5%. The share aged 50 and older was 20.9%, also higher than the genre average of 17.2%. Those aged 13 to 19 accounted for 5.6% (genre average 7.2%), 20 to 24 for 9.1% (genre average 10.1%), 25 to 29 for 10.6% (genre average 11.3%), and those in their 30s for 23.1% (genre average 24.6%).
This age distribution serves as reference data for reviewing ad targeting and does not represent the actual customer base. To interpret a lower search share among younger groups compared to the genre average as customer churn, behavioral data across specific channels must also be reviewed.
| Starbucks | Coffee and Cafe Genre Average | |
|---|---|---|
| Female share | 68.4% | 70.0% |
| Ages 13 to 19 | 5.6% | 7.2% |
| Ages 20 to 24 | 9.1% | 10.1% |
| Ages 25 to 29 | 10.6% | 11.3% |
| In their 30s | 23.1% | 24.6% |
| In their 40s | 30.6% | 29.5% |
| Aged 50 and older | 20.9% | 17.2% |
Where do users go right after searching for Starbucks?
Examining what information users look for after searching for "Starbucks" helps determine what content is needed on landing pages. In a sample of 30 paths, searches leading to "Starbucks menu," "Starbucks order," and "Starbucks careers page" appear frequently. However, another brand, "Peet's Coffee," also appears, so paths should not be interpreted as leading solely to internal brand information.
Before using the frequency of subsequent search queries for ad review, confirm whether the presented paths represent the full sample. In the sample of 30 paths, the following subsequent search queries are shown: "Starbucks menu" 10 times, "Starbucks order" 5 times, and "Starbucks careers page" 5 times. Next, "cafe near Osaka Castle" appears 2 times, "Strawberry Frappuccino" 1 time, and US coffee brand "Peet's Coffee" 1 time. The sum of the paths shown in the table is less than the total sample size, and queries for the remaining paths are not disclosed. Therefore, you should not assume that other domestic franchise names are absent from the entire sample.
Searches leading to "Starbucks careers page" have a different intent from checking menus or ordering. In Intent Knowledge Graph analysis, searches for recruitment information are categorized separately from menu and order exploration.
| Subsequent Search Query | Number of Paths |
|---|---|
| Starbucks menu | 10 |
| Starbucks order | 5 |
| Starbucks careers page | 5 |
| Cafe near Osaka Castle | 2 |
| Strawberry Frappuccino | 1 |
| Peet's Coffee | 1 |
How to use this data in practice
In practice, search volume, searcher demographics, and search paths are used for different decisions. Portal search volume is used to monitor changes in brand interest, and gender and age distributions are used to evaluate ad targeting. Subsequent search queries help identify what information users look for next, guiding what content to include on landing pages.
In a brand management checklist, keep search volume changes and searcher composition as separate items. In the search volume changes section, record comparison results with mobile app active user metrics and payment data. In the searcher composition section, compile follow-up research needed for store usage and membership information.
Landing pages for search ads should be structured so that information corresponding to the query is immediately visible. For instance, link menu queries to menu guides and order queries to the ordering screen. However, this path sample only shows subsequent search queries; it does not confirm completed orders or order conversion performance on landing pages.
For example, a product planner might organize "Starbucks tumbler" and "Starbucks cake" as research items for non-beverage merchandise. "Starbucks store music" should be separated from product information and categorized under store experience research. Rather than judging merchandise purchase demand or brand associations with store music solely by search volume, conduct follow-up research to determine what information is sought in each query.
This page does not present the queries and paths used by non-customers before they decide on a brand name. Therefore, this data alone should not be used to decide whether to connect ads to the brand search stage or the early exploration stage.
How the data was counted
- Data: ListeningMind Brand Finder South Korea edition, 48 months from Sep 2022 to Aug 2026. Sum of Naver and Google monthly search volumes.
- Monthly average search volume: Average over the most recent 12 months (Sep 2025 to Aug 2026). Sum of standalone brand name searches and "brand + product/modifier" searches.
- Year-over-year: Comparison of the average of the most recent 12 months against the preceding 12 months. Versus three years earlier: Comparison against the average of the first 12 months (left blank and marked "New" if the first 12-month value is less than 10% of recent volume).
- Share within genre: Proportion relative to the total search volume of the 13 brands included in this genre. Inclusion criteria follow Brand Finder genre rules.
- Search paths: ListeningMind path_finder, "Starbucks", sample of 30 paths, retrieved on 2026-10-21.
- Search volume reflects the scale of interest and is not a statistic on sales volume or market share.
- Other articles in the same genre are available in the Coffee and cafe genre collection.
Questions
- What are the search volume and search share of Starbucks in the South Korean market?
- From September 2025 to August 2026, Starbucks recorded an average monthly search volume of 2,435,360 in the South Korean coffee and cafe genre. It accounted for 27.8% of total searches in the genre, maintaining 1st place following the previous year.
- How much has Starbucks search volume decreased?
- Based on monthly averages from September 2025 to August 2026 in South Korea, Starbucks search volume decreased by -10.2% year-over-year and declined by -20.7% compared to three years earlier.
- Is Starbucks search volume the same as actual visitor numbers or sales volume?
- This figure represents search volume for Starbucks on portals and does not directly match actual store visitor counts or product sales volume.
- Did other domestic coffee franchises appear in Starbucks search paths?
- Because the sum of paths shown in the table is less than the total sample size and queries for the remaining paths are not disclosed, it should not be assumed that other domestic franchise names are absent from the entire sample.
Sources
- ListeningMind Brand Finder · 한국 · 2022.09~2026.08 월간 검색량 · 2026-10-09
- ListeningMind path_finder · kr · 2026-10-21