
ListeningMind.AI / Wiki / Marketing AX for companies
Marketing AX KPIs: Acquiring New Customers, Not Agent Count
The success of marketing AX should be judged not by the number of agents or the speed of report generation, but by whether someone who was not previously a customer actually became a customer. It is measured in four stages: discovering new demand, readiness to answer, new customer acquisition, and sustainability of growth.
GuideDanny ParkCEO, Ascent AI·Updated 2026-10-22 15:29 KST·History · 2 contributorsEditSign in to edit
Operational Metrics and Growth Metrics
How quickly AI generates reports, how many agents are deployed, and how much content production costs are reduced are meaningful operational metrics. However, they alone cannot explain why a business grew. Customer-First Marketing AX shifts the focus of measurement from technology to the customer.
Measured in Four Stages
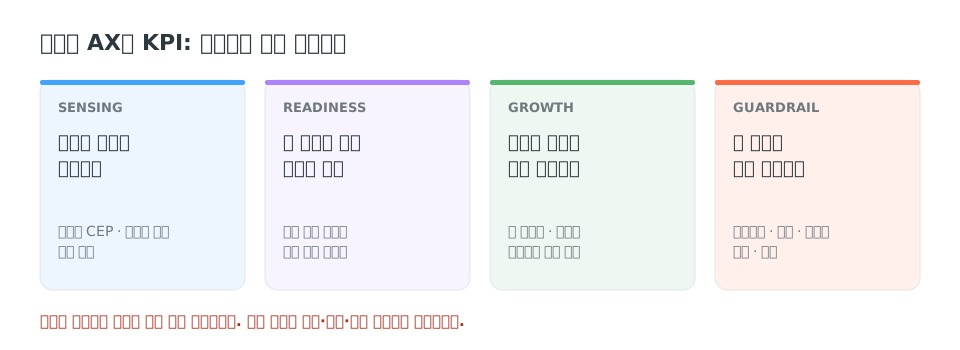
| Stage | Question Asked | Example Metrics |
|---|---|---|
| Sensing | Did we identify new demand? | Validated CEPs, unresolved questions, customer friction |
| Readiness | Are we ready to answer those questions? | Official information coverage rate, purchase process completion rate |
| Growth | Did new customers actually arrive? | First-time buyers, penetration rate, category usage expansion |
| Guardrail | Is that growth sustainable? | Acquisition cost, margin, accuracy, complaints and returns |
Points to Note
- An increase in search volume does not necessarily mean an increase in new customers.
- You cannot conclude that sales increased just because a brand appeared more frequently in AI answers.
- If you changed the navigation structure of a product list or descriptions on a product detail page, verify the effect using controlled experiments and purchase data.
Intent data is a leading signal for finding opportunities. The final growth effect is verified through experimental, purchase, and financial data.
Feedback Loop
Identify new problems from external demand signals, refine products, content, and commerce, observe market reactions, and reflect the results in subsequent decisions. The goal is not just collecting more data, but continuously improving the process of reaching customers.
How Organizations Work
Product planning, marketing, merchandising, data analysis, and development usually work toward different goals with different systems. However, consumers do not divide problems according to a company's organizational chart. You must connect contexts discovered in the market with internal product attributes, pricing, inventory, and sales data, and ensure relevant teams use the same definitions and evidence.
API, MCP, and Skills are ways to move data and knowledge trapped inside analytics screens into marketers' AI, planning teams' workspaces, and the company's product systems. However, AI tools built separately by each department do not automatically become a company-wide execution structure. Standards are required for data permissions and security, sources of truth for official product information, modification approvals and deployment, performance measurement, and error verification and rollbacks. The sequence for the entire company is outlined in the AX Hub.
Questions
- Should operational metrics be discarded?
- No. Keep tracking operational metrics, but look at growth metrics separately to see whether those improvements lowered barriers for customers and brought in new customers.
- How is Readiness measured?
- It is measured by the percentage of frequently asked customer conditions that can be answered using official product information, and the percentage of purchase processes that agents or humans can complete to the end.